What kind of gear is being used at the KAP Sani2c? With over 4000 participants, it’s one of the most significant South African mountain bike events. Having done our first TREAD Sani2c survey in 2017, we also have stats to compare to. Which are the most dominant helmet, shoe and tyre brands? And which is the most popular motor car brand? What clothing choices are being made?
Our survey had a total of 566 responses, which from a total race entry number of 4060 is an ideal sample size for 95% confidence level and 5% margin for error.
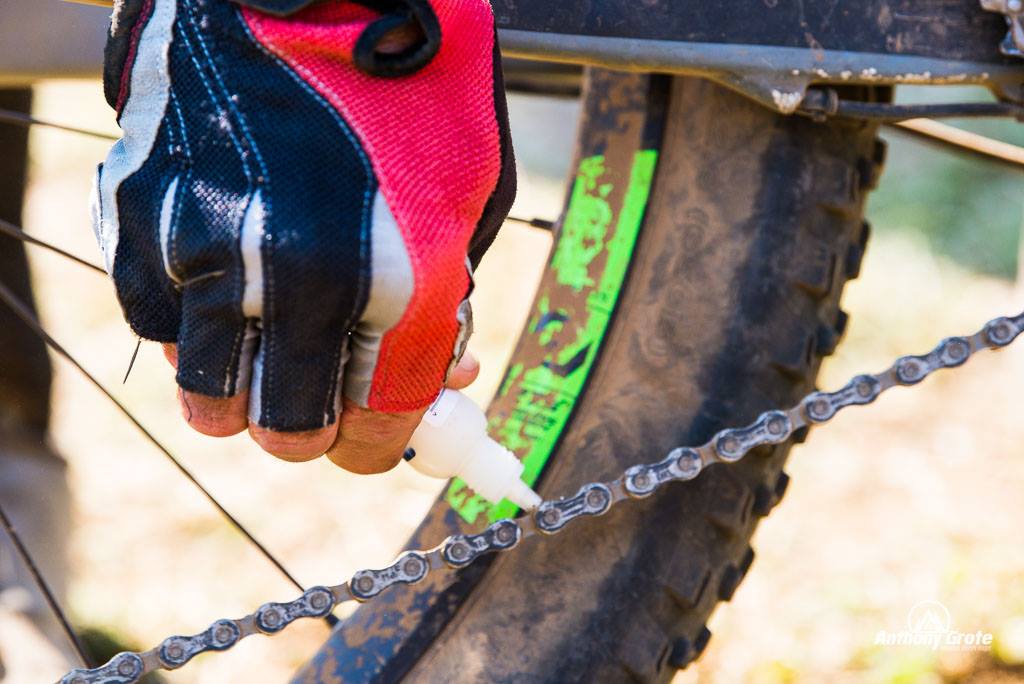
Shoe brand
| 2018 | 2017 | ||
| Specialized | 27.45% | Specialized | 32.98% |
| Shimano | 13.45% | Shimano | 14.21% |
| Sidi | 11.45% | Louis Garneau | 10.25% |
| SCOTT | 8.18% | Sidi | 7.69% |
| Giro | 7.09% | Giro | 7.57% |
| Louis Garneau | 6.90% | SCOTT | 4.77% |
| Bontrager | 5.63% | Olympic | 3.37% |
| Olympic | 2.72% | Bontrager | 2.68% |
| Mavic | 2.18% | Mavic | 2.68% |
| Fizik | 1.63% | Fizik | 2.21% |
| Other | 13.32% | Other | 11.53% |
Specialized still occupies the top spot, by a big margin. The biggest improvement over last year is Bontrager, with SCOTT and Sidi also moving up. Louis Garneau seems to be the biggest faller in these rankings.
Shoe age
| 2018 | 2017 | |
| I bought them in the last year | 28.86% | 26.80% |
| About 1-2 years | 24.32% | 26.11% |
| About 2-3 years | 18.87% | 19.27% |
| About 3-4 years | 13.61% | 14.94% |
| About 4-5 years | 9.62% | 6.39% |
| Older than 5 years | 4.72% | 6.50% |
Two percent more bought shoes in the last year compared to the previous year. A total of 27.95% haven’t bought shoes in the past three years or longer. Although there are exceptions, three years is widely considered the lifetime of a mountain bike shoe that’s worn regularly.
Tyre brand
| 2018 | 2017 | ||
| Maxxis | 43.76% | Maxxis | 38.40% |
| Specialized | 14.01% | Specialized | 17.14% |
| Schwalbe | 11.90% | Schwalbe | 14.37% |
| Continental | 10.55% | Continental | 9.78% |
| Vittoria/Geax | 9.21% | Vittoria/Geax | 6.88% |
| Bontrager | 3.83% | Onza | 2.53% |
| Onza | 1.15% | Bontrager | 1.69% |
| Chaoyang | 0.95% | Mitas | 1.08% |
| Mavic | 0.76% | WTB | 0.96% |
| WTB | 0.57% | Vredestein | 0.72% |
| Other | 3.31% | Other | 6.40% |
Maxxis increased its share of the Sani2c participant market by over 5% compared to 2017. It’s still by far the most popular tyre brand at this event. Other brands that improved over the past year were Vittoria/Geax, Bontrager and Continental, with Chaoyang and Mavic making their way into the top 10. Specialized and Schwalbe still hold second and third rankings respectively, but both dropped a little in their Sani2c market-share percentages.
Tyre preparation
| 2018 | 2017 | |
| I bought two new tyres for Sani2c | 29.43% | 22.71% |
| I bought one new tyre for Sani2c | 18.13% | 20.12% |
| My current tyres were just fine | 52.44% | 57.18% |
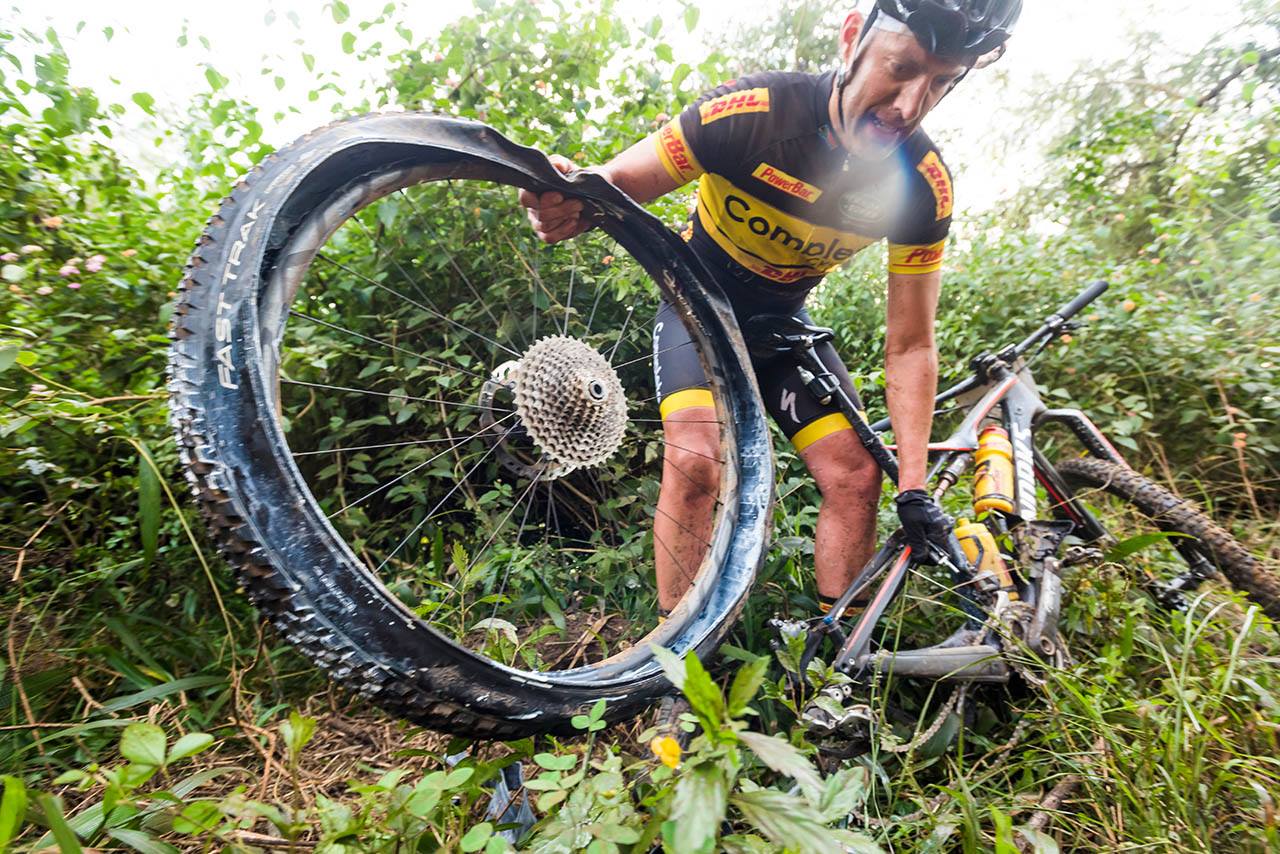
Year on year, more riders bought two new tyres in preparation for Sani2c – more than six percent more, which is quite a leap. If you’re going to invest money in your entry fee and Sani2c trip and the time to train for it, might as well reduce the risk of the most common race-ruining cause – tyre drama…
Tyre preference
| 2018 | 2017 | |
| Light weight, I don’t mind the higher puncture risk | 7.99% | 7.34% |
| Reinforced sidewalls, I rather have heavier tyres than risk punctures | 78.36% | 78.93% |
| Good price, I can’t bring myself to spend a lot on tyres | 13.65% | 13.73% |
Almost exactly the same numbers at the previous year, with the majority preferring a slightly heavier, more puncture resistant tyre.

Eyewear brand
| 2018 | 2017 | ||
| Oakley | 37.10% | Oakley | 32.56% |
| Rudy Project | 27.18% | Rudy Project | 29.55% |
| Adidas | 9.72% | Adidas | 10.37% |
| Ocean | 6.15% | D’Arcs | 5.18% |
| D’Arcs | 3.96% | Ocean | 4.46% |
| Uvex | 1.98% | Uvex | 1.44% |
| Tifosi | 0.79% | Bondi Blu | 0.84% |
| SCOTT | 0.79% | Bolle | 0.72% |
| Bondi Blu | 0.59% | Nike | 0.60% |
| Assos | 0.59% | Cebe | 0.60% |
| Other | 11.15% | Other | 13.63% |
Oakley increased its share of the Sani2c market, while it’s two primary rivals, Rudy Project and Adidas both lost a little ground since 2017. Ocean and Uvex also improved their ranking and percentages, while Bondi Blu dropped a bit. SCOTT, Tifosi and Assos all entered the top 10 this year.
Helmet brand
| 2018 | 2017 | ||
| Specialized | 20.54% | Specialized | 22.09% |
| Rudy Project | 14.54% | Bell | 14.88% |
| Bell | 10.00% | Rudy Project | 13.60% |
| Giro | 9.45% | Giro | 8.95% |
| SCOTT | 8.54% | SCOTT | 7.20% |
| Catlike | 5.09% | Catlike | 5.00% |
| Fox | 3.45% | MET | 2.79% |
| Bontrager | 2.72% | Fox | 2.67% |
| Kask | 2.72% | Kask | 2.44% |
| POC | 2.54% | Uvex | 2.09% |
| Uvex | 2.00% | POC | 2.09% |
| Lazer | 2.00% | Other | 16.16% |
| Other | 16.41% |
Although it lost a little of its Sani2c market-share, Specialized remained the most popular helmet for another year. Brands that grew slightly were Rudy Project, Giro, SCOTT, Catlike, Fox, Kask and POC, while Bell dropped from second to third in the top 10. Bontrager and Lazer both entered the top 10 strongly in 2018.
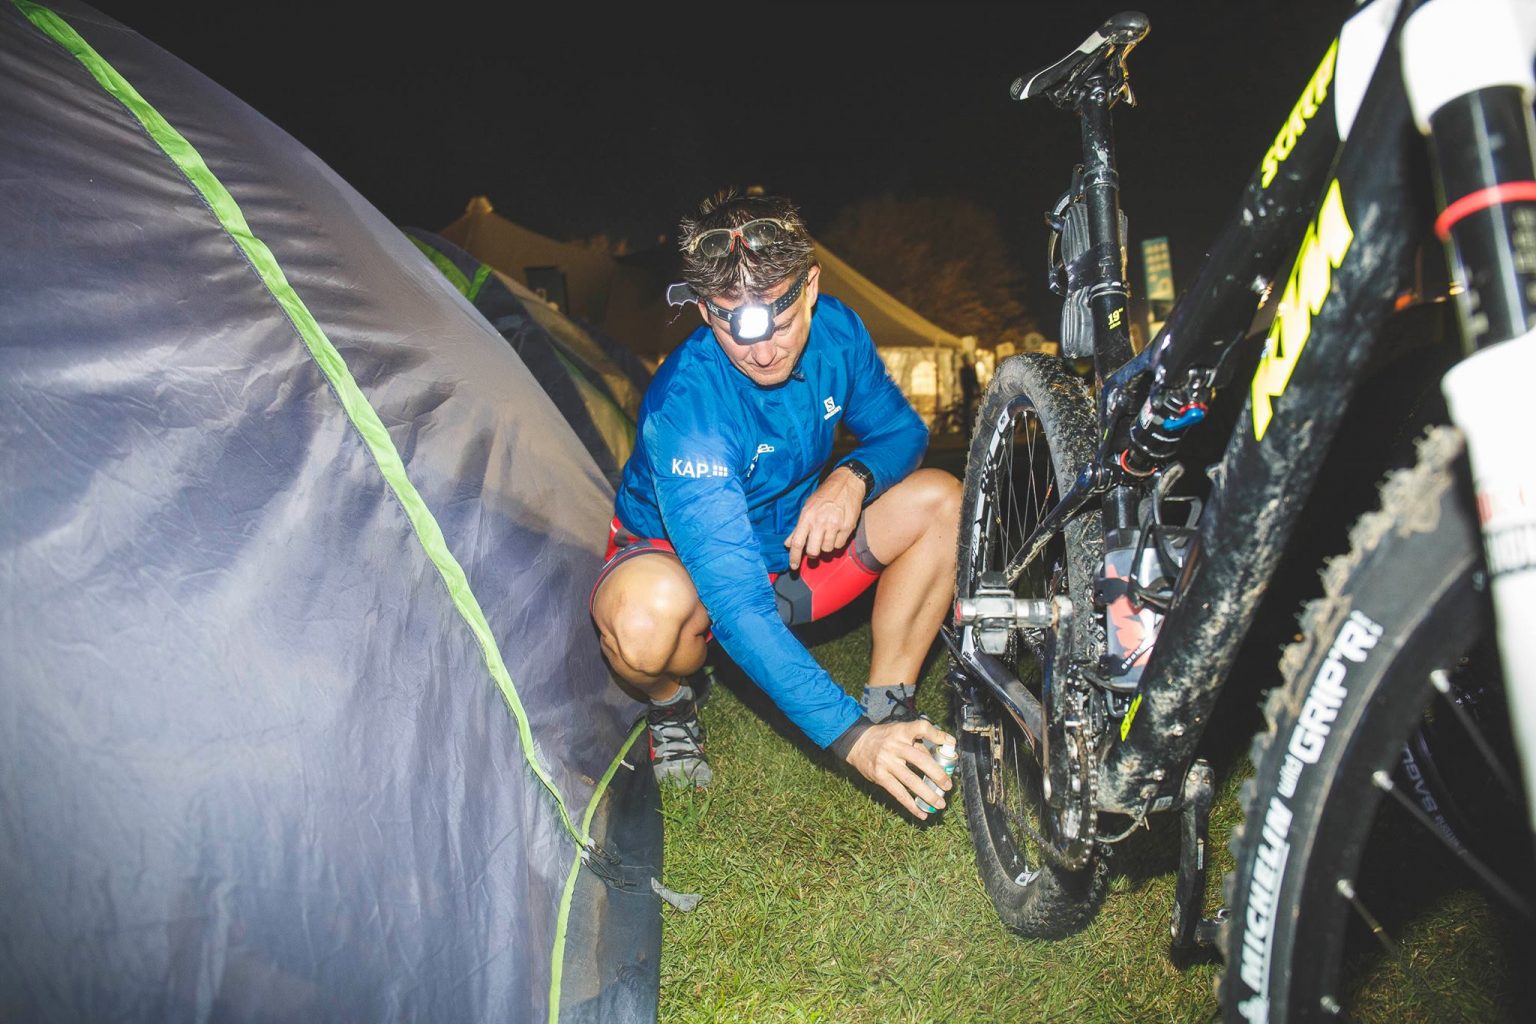
Helmet age
| 2018 | 2017 | |
| I bought it in the last year | 33.94% | 27.89% |
| About 1-2 years | 22.14% | 24.00% |
| About 2-3 years | 18.87% | 22.29% |
| About 3-4 years | 11.98% | 12.34% |
| About 4-5 years | 5.81% | 7.31% |
| Older than 5 years | 7.26% | 6.17% |
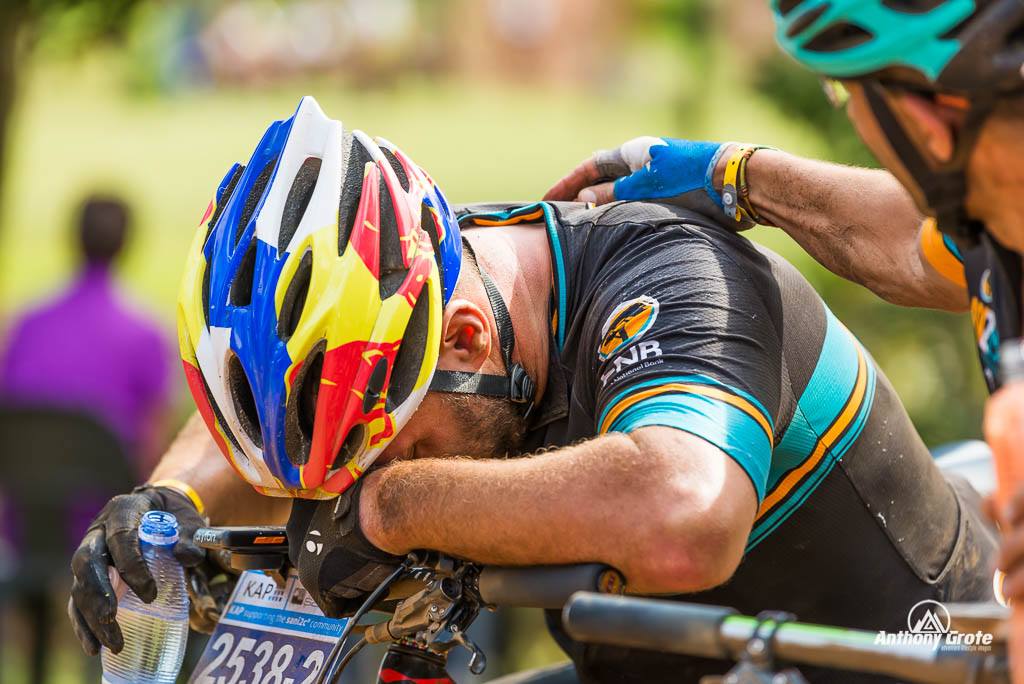
A five point increase in the percentage of those that bought a helmet in the past year is quite a leap. There’s never been a wider range of helmets (and colour options) at such competitive pricing, making this an easier decision for many. However safety really should be the primary objective when it comes to helmets and the 25.05% who have had their helmet for three years or more should consider updating their lids from a peace-of-mind (and safety) perspective.
 Socks
Socks
| 2018 | 2017 | |
| Socks? I don’t wear socks | 0.18% | 0.11% |
| I like short socks | 41.56% | 45.42% |
| I like mid-calf length socks | 35.57% | 32.95% |
| I’m a sock nut. My socks are immaculate and match my kit | 19.96% | 17.51% |
| I just wear whatever socks I have | 17.60% | 20.71% |
Definitely a mindset shift towards socks over the past year with ‘mid-calf length’ and ‘I’m a sock nut’ both seeing increased percentages over 2017’s stats.
Riding jerseys
| 2018 | 2017 | |
| I was given corporate jerseys to wear | 15.97% | 15.17% |
| My teammate and I wore matching jerseys | 57.53% | 56.6% |
| I just wore whatever jerseys I already have | 26.50% | 28.16% |
Not too much changed here. Good to see most teammates like to wear the same jerseys. It always looks better in the photos too…
Riding shorts
| 2018 | 2017 | |
| Tight Lycra shorts | 89.11% | 86.64% |
| Baggy shorts | 3.27% | 4.11% |
| Baggy shorts over tight Lycra shorts | 7.62% | 9.25% |
Tight Lycra shorts favoured even more… Makes sense though. Three days of saddle time require maximum comfort.
Gloves
| 2018 | 2017 | |
| I used long-finger gloves | 50.64% | 54.47% |
| I used short-finger gloves | 48.46% | 44.15% |
| I ride without gloves | 0.91% | 1.38% |
Long-finger gloves still favoured over short-finger version. But only just… When it’s hot, long-fingered gloves can feel a bit uncomfortable for some.
Bike rack brand
| 2018 | |
| Thule | 74.21% |
| Holdfast | 8.00% |
| Buzz | 6.05% |
| Menabo | 0.78% |
| Double D | 0.78% |
| Atera | 0.58% |
| Bosal | 0.58% |
| Saris | 0.58% |
| Homemade | 0.58% |
| Front Runner | 0.39% |
| Dixon | 0.39% |
| Other | 7.66% |
This was the first time we have included bike rack brands in our survey. We weren’t really surprised to see Thule as the leader, but were surprised to see how significant a lead it has here.
Motor car brand
| 2018 | |
| Toyota | 27.18% |
| Volkswagen | 13.39% |
| Ford | 11.06% |
| Land Rover/Range Rover | 8.15% |
| Mitsubishi | 5.43% |
| Mercedes | 4.27% |
| Audi | 4.27% |
| Nissan | 3.88% |
| BMW | 3.10% |
| Volvo | 2.71% |
| Mazda | 2.52% |
| Hyundai | 2.52% |
| Other | 11.52% |
Another first for our survey – primary motor car brand driven by Sani2c participants. This is the top 10.
Did you miss the first part of our 2018 KAP Sani2c survey reveal. It contains stats and info about the riders and can be seen here: https://www.treadmtb.co.za/kap-sani2c-riders-stats-the-2018-reveal/


