There’s been much discussion about the increased pace of the 2017 Absa Cape Epic. A race that’s traditionally been an endurance test became somewhat of a speed test this year – and it caught many off guard. Their training wasn’t for speed and intensity; their training was for endurance and strength. We examine exactly why this happened and wonder if this is the new face of the Cape Epic or if it’s going to return to the Epic of old when the 2018 route is announced in October…
By Sean Badenhorst
Photos by Dino Lloyd
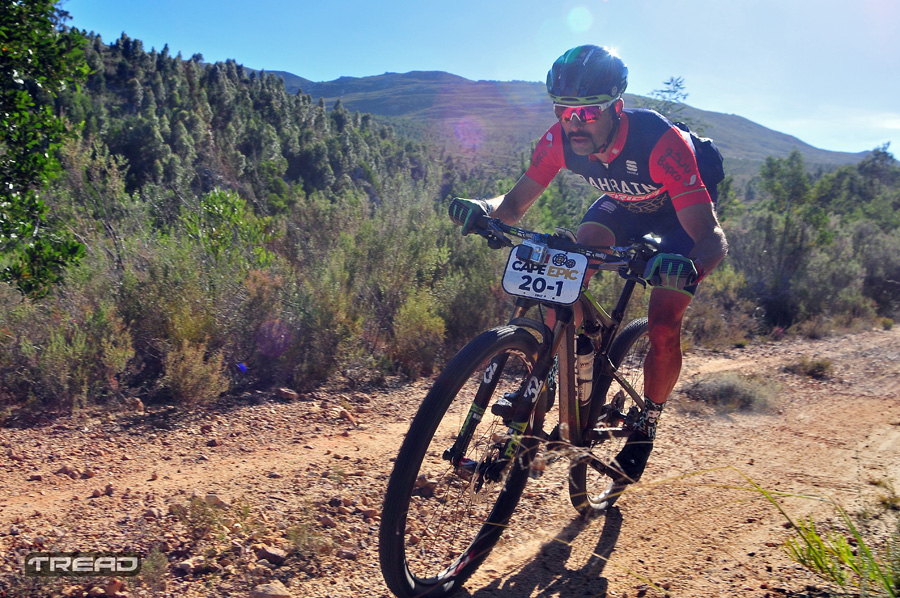
Photo: Dino Lloyd/Tread MTB
What happened to the men’s race at the Absa Cape Epic this year? Every top male competitor we spoke to, or who was quoted in the media, said that it was faster and more intense than ever before. This includes both five-time winners, Karl Platt and Christoph Sauser who have completed 13 and 12 editions respectively.
This was Sauser’s comment:
“I think this year has shown that the dynamic of the Cape Epic has changed. Previously you could go slow and warm up in the first hour, but this year it has been full-on for the first hour of the race. You needed to ride really hard as there was no let up. This week you had to stay up the front the whole time, there was just no slacking of pace. That can be tiring physically and emotionally. Going forward, I think we will see faster starts now and riders will have to change the way they train, focussing more on speed and cutting back on long hours as the race start gets closer.”
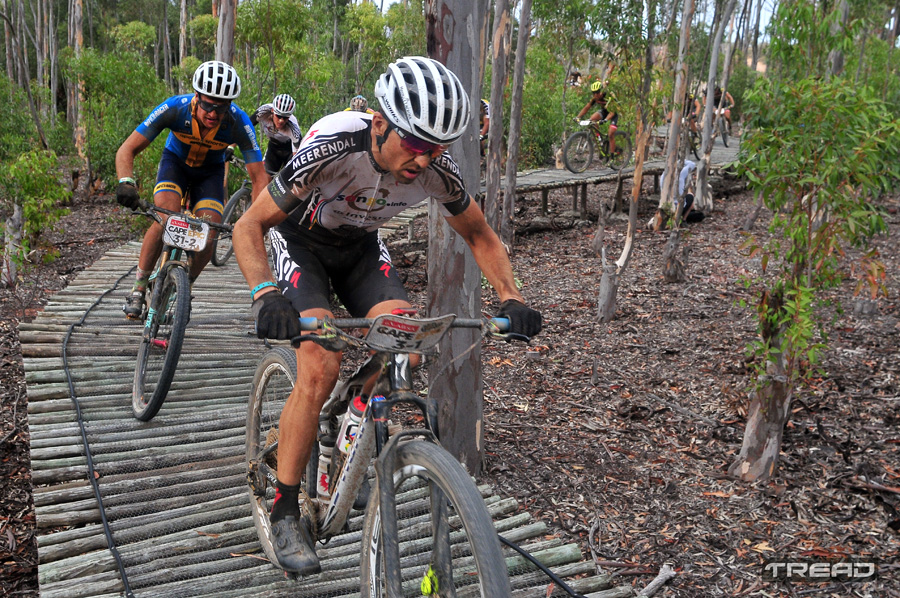
Photo by Dino Lloyd/Tread MTB
It’s like someone just decided that the old race pattern of ‘start steady and finish strong’ should change to ‘start fast and see how long you can hold that pace’…
“We sat on rollers warming up before the start of every stage,” Matthys Beukes of Pyga Eurosteel told us. “The racing was just super fast from the start and if you weren’t ready for that you were in trouble. It was really intense. Different from before.”
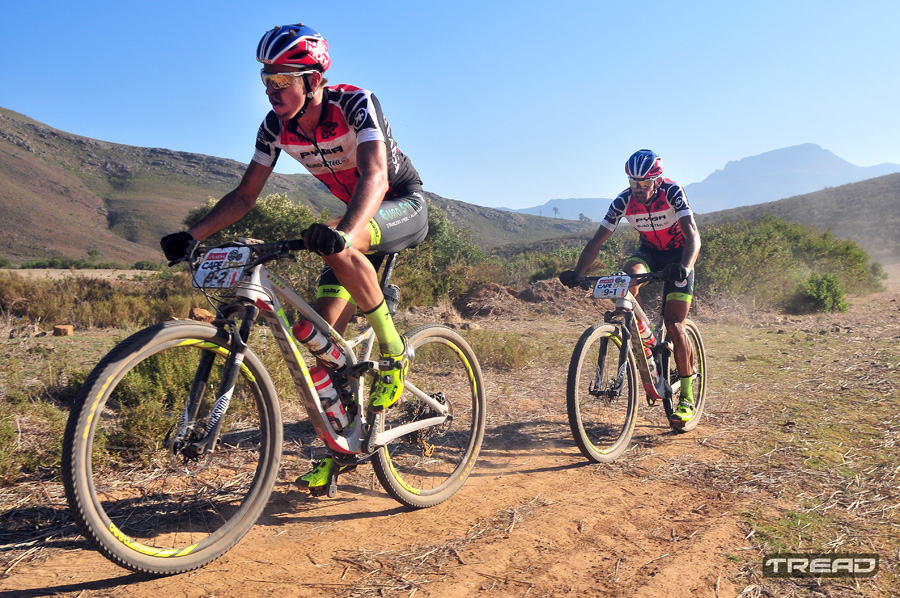
Photo: Dino Lloyd/Tread MTB
Rollers before the Prologue, sure. Rollers before the start of a 100km-plus stage? Shew.
But that was the nature of the race up front this year.
We believe there are two primary reasons for this:
- The first four days were unusually short.
- The aggressive strategy of the XCO-focussed men’s teams (helped by the first four days being unusually short).
The first four days
Consider these stats which look at the first half of the 2017 edition vs the first half of the previous five.
| Year | 2017 | 2016 | 2015 | 2014 | 2013 | 2012 |
| Distance | 267km | 323km | 353km | 366km | 363km | 408km |
| Elevation | 6200m | 7300m | 8000m | 6500m | 7500m | 7800m |
| Time leaders | 11:05:51 | 14:22:36 | 14:42:29 | 14:56:41 | 14:58:25 | 15:37:33 |
| Ave speed leaders | 24.06kph | 22.47kph | 24.00kph | 24.49kph | 24.24kph | 26.11kph |
| Time 100th place | 14:54:43 | 19:08:58 | 19:17:46 | 19:19:25 | 20:14:57 | 20:37:58 |
| Ave speed 100th place | 17.91kph | 16.87kph | 18.29kph | 18.94kph | 17.93kph | 19.77kph |
| Time 300th place | 18:02:29 | 23:26:00 | 23:30:57 | 22:57:35 | 24:19:28 | 25:07:17 |
| Ave speed 300th place | 14.8kph | 13.78kph | 15.01kph | 15.94kph | 14.92kph | 16.24kph |
Photo: Dino Lloyd/Tread MTB
Days 1-4 comparisons
| Year | 2017 | 2012-2016 average | Difference |
| Distance | 267km | 362km | 95km |
| Elevation | 6200m | 7420m | 1220m |
| Time leaders | 11:05:51 | 14:54:02 | 3:48:11 |
| Ave speed leaders | 24.06kph | 24.26kph | 0.20kph |
| Time 100th place | 14:54:43 | 19:36:00 | 4:41:17 |
| Ave speed 100th place | 17.91kph | 18.47kph | 0.56kph |
| Time 300th place | 18:02:29 | 23:51:36 | 5:49:29 |
| Ave speed 300th place | 14.8kph | 15.17kph | 0.37kph |
| 2017 | Days 1-4 | Days 5-8 |
| Distance | 267km | 384km |
| Elevation | 6200m | 8350m |

Photo: Dino Lloyd/Tread MTB
Worth noting:
- The distance covered to Day 4 this year compared to the average of the previous five editions, was 95km shorter.
- The total elevation to Day 4 this year compared to the average of the previous five editions was 1220m less.
- The time of the leading team to Day 4 was 3 hours 49 minutes shorter than the average time of the previous five editions. The time difference of the 100th team was 4:41:17 and the 300th team was 5:49:29.
- The average speed of the leading team to Day 4 was 0.2kph faster than the average of the previous five editions. The faster average speeds further back (taken on 100th and 300th places) were more marked than the leaders compared to the previous five editions. But average speed isn’t the best factor to consider here as the route changed markedly from 2016 with more twisty, steep singletrack than before.
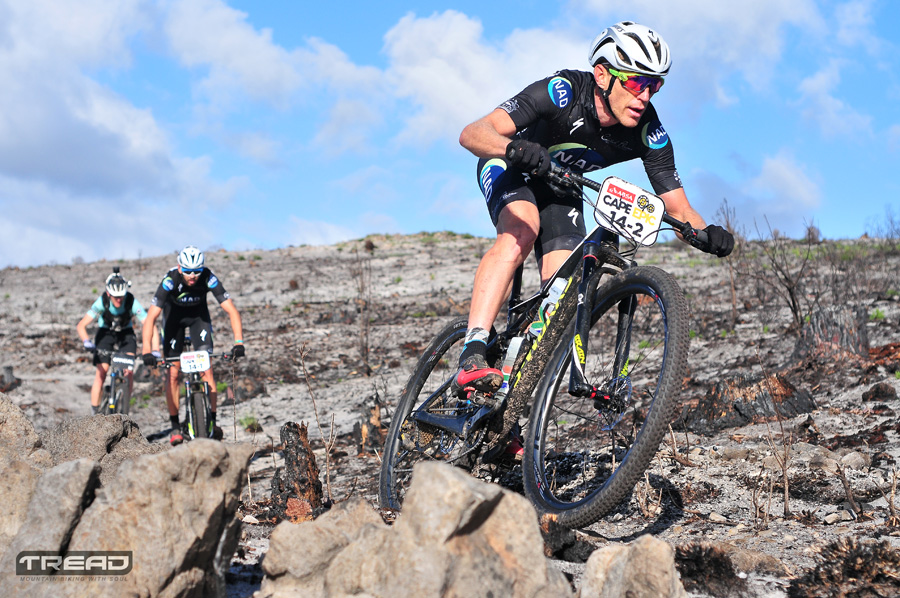
Photo: Dino Lloyd/Tread MTB
So, the first half of the 2017 edition of the Cape Epic was substantially shorter in distance, duration and elevation than the average of the previous five editions.
This is obviously partly as a result of the shortening by 40km of Stage 2. The top guys raced almost four hours less than the 2012-2016 average, while 100th and 300th places raced for 4:41:17 and 5:49:29 less respectively. They also raced 95km and 1220m (ascent) less. All of that pretty much makes up a one whole Cape Epic stage…
Up until Day 4, the average daily race distance in 2017 was 66.75km, shorter than most South African one-day marathons. This compared the daily average from the previous five years, which was 90.5km. So, the first half of the 2017 Cape Epic was almost 30% shorter with almost 20% less ascent than the average of the previous five editions.
From Days 5-8, the daily average stage distance at this year’s race was 96km. Quite a big jump from 66.75km per day…
| Year | Winning time | Winning ave speed | 100th position time | Gap from 1st to 100th position |
| 2017 | 26:35:06 | 24.49kph | 35:12:02 | @8h37m |
| 2016 | 28:13:28 | 23.17kph | 37:10:08 | @08h56m |
| 2015 | 31:00:57 | 24.61kph | 41:11:39 | @10h10m |
| 2014 | 30:31:59 | 23.51kph | 40:06:06 | @9h28m |
| 2013 | 29:40:44 | 23.78kph | 40:03:39 | @10h22m |
| 2012 | 31:46:50 | 24.38kph | 44:00:02 | @12h46m |
| 2011 | 28:44:44 | 24.62kph | 39:08:39 | @10h23m |
| 2010 | 29:47:46 | 22.18kph | 41:10:43 | @11h22m |
| 2009 | 28:10:13 | 26.41kph | 38:53:37 | @10h43m |
| 2008 | 36:01:44 | 26.80kph | 50:13:45 | @14h12m |
| 2007 | 33:08:00 | 26.74kph | 46:30:49 | @13h22m |
| 2006 | 34:41:41 | 27.08kph | 49:04:07 | @15h22m |
| 2005 | 31:20:06 | 28.65kph | 46:38:53 | @15h18m |
| 2004 | 31:02:55 | 25.37kph | 44:48:51 | @13h46m |
From an average speed perspective, the 2017 edition wasn’t the fastest. It was the ninth fastest. But average speeds over the years have been affected by type of route (many long gravel roads in the early days which helped increase average speed), by wheel size (29-inch wheels roll faster than 26-inch wheels) and by terrain (rugged terrain and twisty singletrack will always slow the average speed down).
But there were a number of similarities between the 2017 route and conditions and the 2016 route and conditions that we feel are worth noting.
Similarities between 2017 and 2016 (with the shortened Stage 2)
| Year | Distance | Elevation | Average gradient |
| 2016 | 647km | 14950m | 23.1m/km |
| 2017 | 651km | 14550m | 22.4m/km |
The 2017 winning average speed was faster than the 2016 edition by 1.32kph, which is just over 5% faster. Go out and race your bike 5% faster than you normally do for 4 or 5 hours and see just how difficult that becomes. Then repeat that for a week.
The depth of the UCI men’s field was significantly greater this year than last year and all of the four teams that won stages are XCO specialists, although you could say that Investec-Songo-Specialized was only half XCO specialist in nature, with Sauser no longer competing in the lap-racing format, but still a former XCO World Champion and multiple XCO World Cup winner.
It was always expected that the XCO teams would try to win the prologue as that’s their best shot at a stage win and earning the race leader’s jersey. And besides, it was only a distance of 26km.
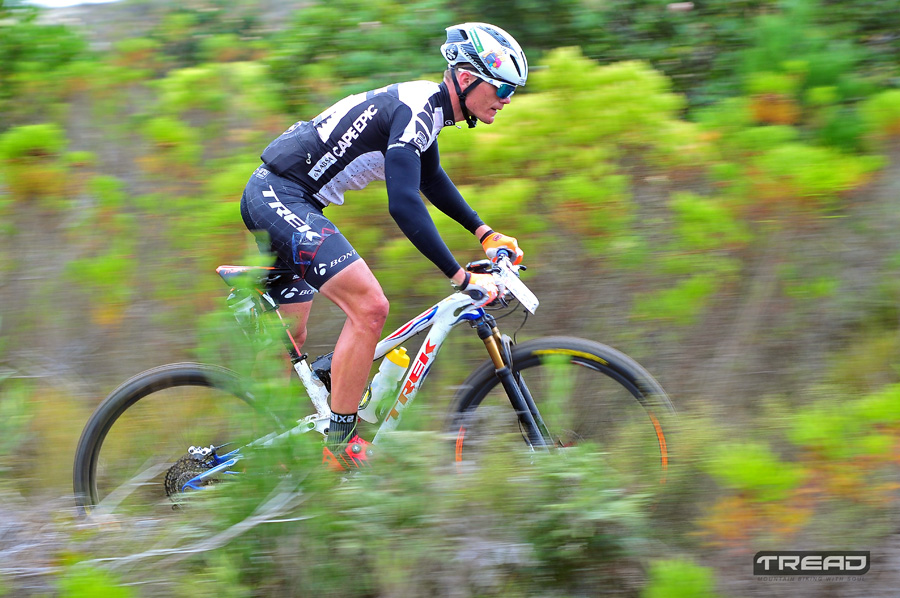
Photo: Dino Lloyd/Tread MTB
On Stage 1, everyone is always still fresh so the XCO teams were still able to give the relatively tough 101km stage a good go. Then Stage 2 was shortened, from 102km to 62km due to anticipated dangerous heat. Boy did that suit the XCO racers. And then Stage 3 was a relatively short 78km. And once again, ideal for the XCO specialists.
But while the XCO specialists relished the shorter stages and abbreviated overall first half, the endurance/marathon specialists were trying to hold themselves together. They’d been forced to race at a higher intensity by the XCO racers just to try and stay in touch. But they hadn’t expected that kind of pace and pressure. They hadn’t trained for it. The Bulls and Topeak Ergon were two teams, each containing former winners, that were undoubtedly undone by the fast pace.
By the time Stage 4 (Day 5) rolled around, a more traditional Cape Epic stage over 112km with 2150m of ascent, the endurance/marathon specialists like Karl Platt and Urs Huber (Team Bulls) and Alban Lakata and Kristian Hynek (Topeak Ergon) were already well down the classification and out of podium reach.
Cannondale Factory Racing’s Manuel Fumic and Henrique Avencini and SCOTT SRAM’s Nino Schurter and Matthias Stirnemann and Andri Frischknecht and Michiel van der Heijden – all XCO specialists – were the primary protagonists in the first half of the race, with the Cannondale Factory Racing duo hanging onto their overall lead, earned on Day 1, until Stage 5 (Day 6). And then the SCOTT SRAM guys finishing off with style on the final two days.
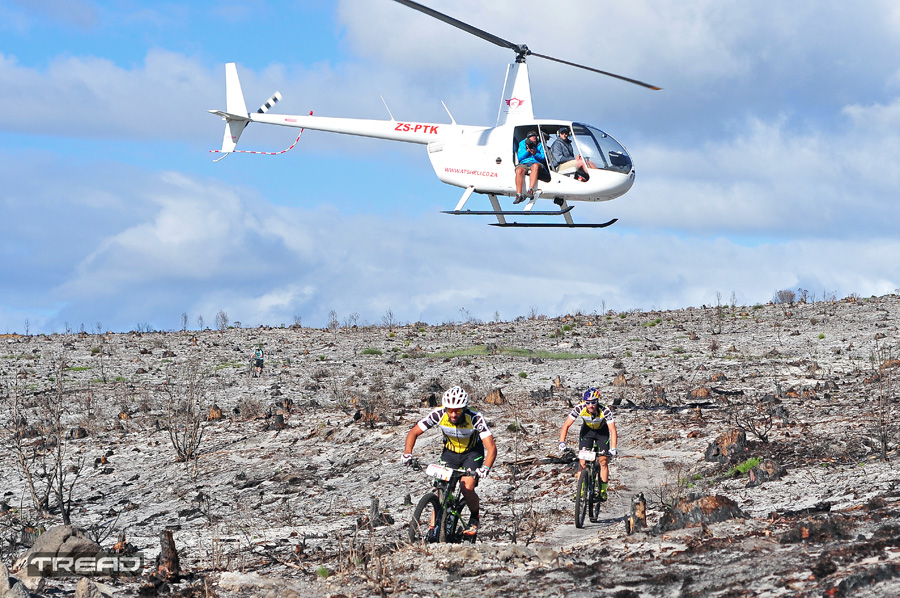
Photo: Dino Lloyd/Tread MTB
The intensity and speed of the 2017 Cape Epic were undoubtedly unprecedented in the race’s 14-year history. Sauser predicts this new style of racing will change the event in future. We’re not as convinced. If the route remains around 650km in distance, as it has for the past two editions, then possibly. But if the route designers return more distance to the race, as with the first 12 editions, the XCO racers will reach their limits too. The big shake up of 2017 was good for the race from a short-term perspective. But many riders, not only the top finishers, told us that they missed the old Epic where endurance was a bigger part of the rider test. They felt the race had lost some of what originally made it, well, epic.
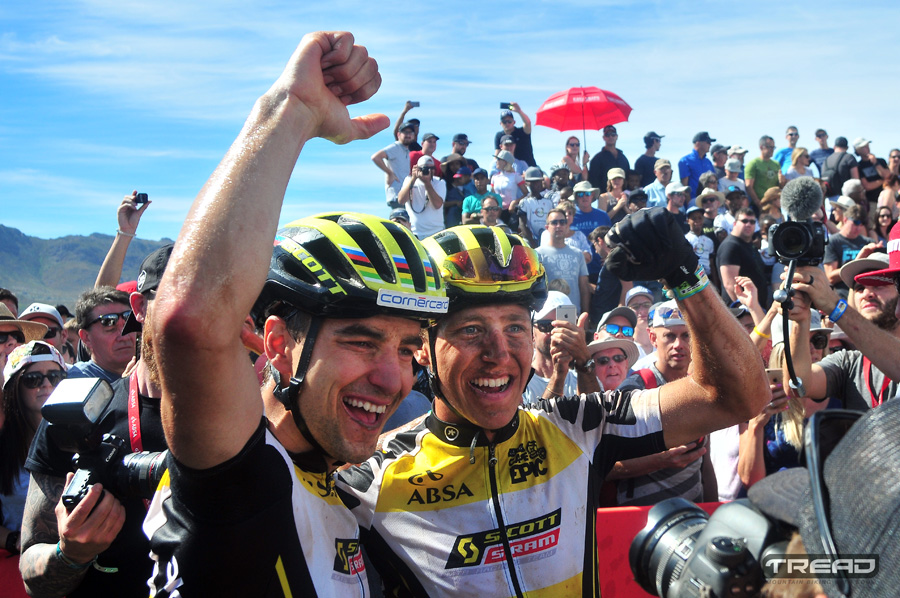
Photo: Dino Lloyd/Tread MTB
Will the 2018 route be longer? Will there be more 100km-plus stages in succession next year? Will the 2018 Cape Epic route look like the routes that built race heroes like Sauser and Platt? Or have we entered a new era? Was 2017 edition the year the Cape Epic changed for good?
For more 2017 Cape Epic analysis: The Bikes, The Gear, The Route, The Riders
All rights reserved


