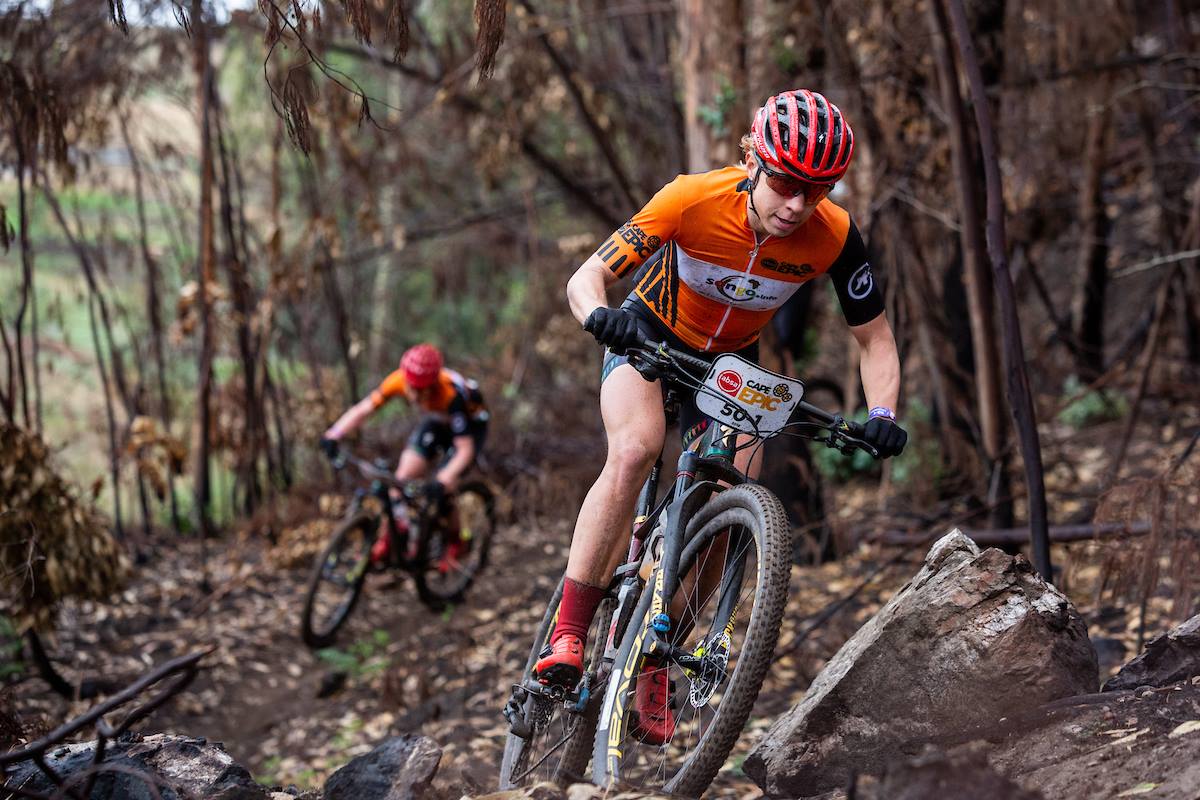
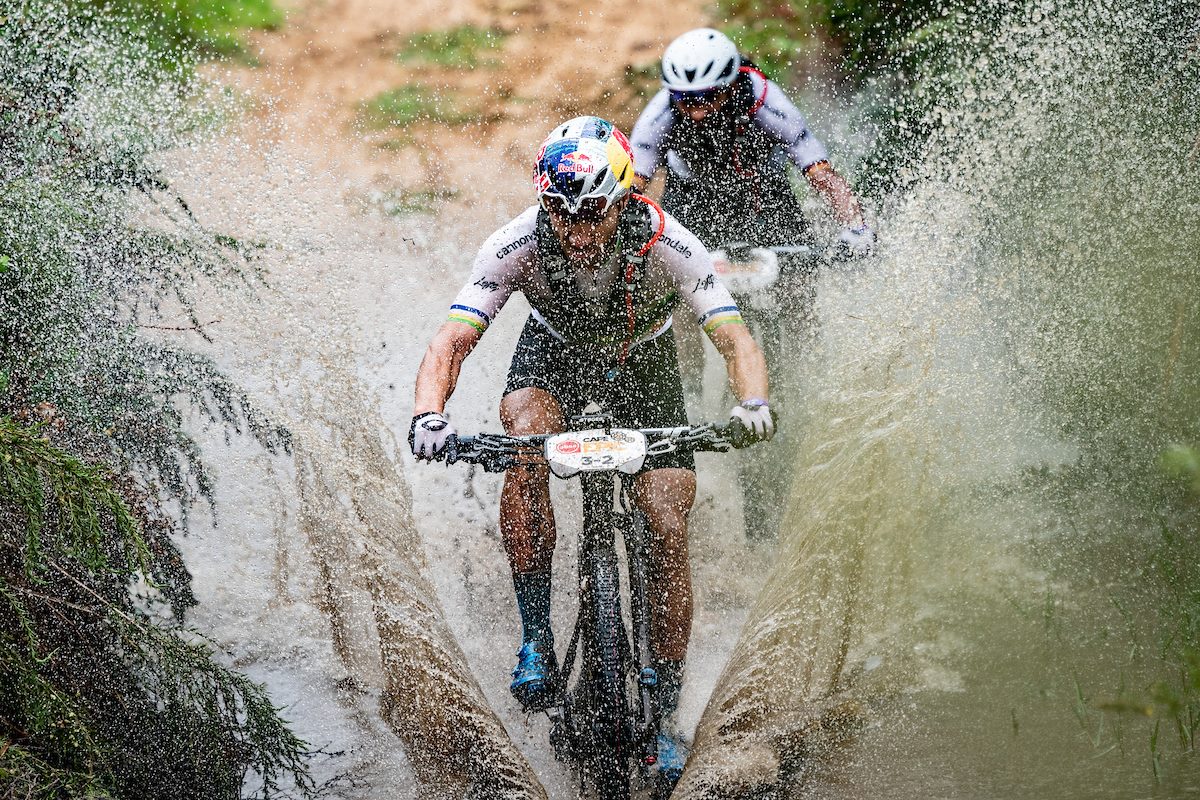
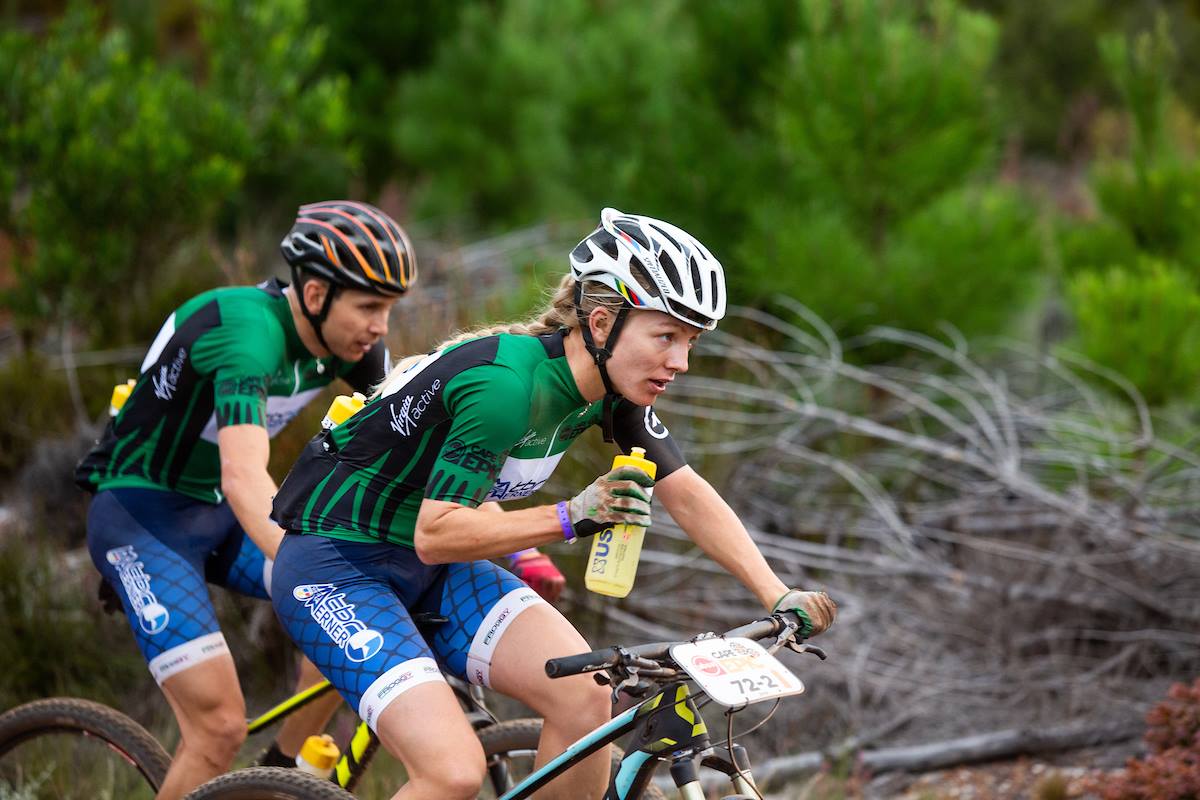
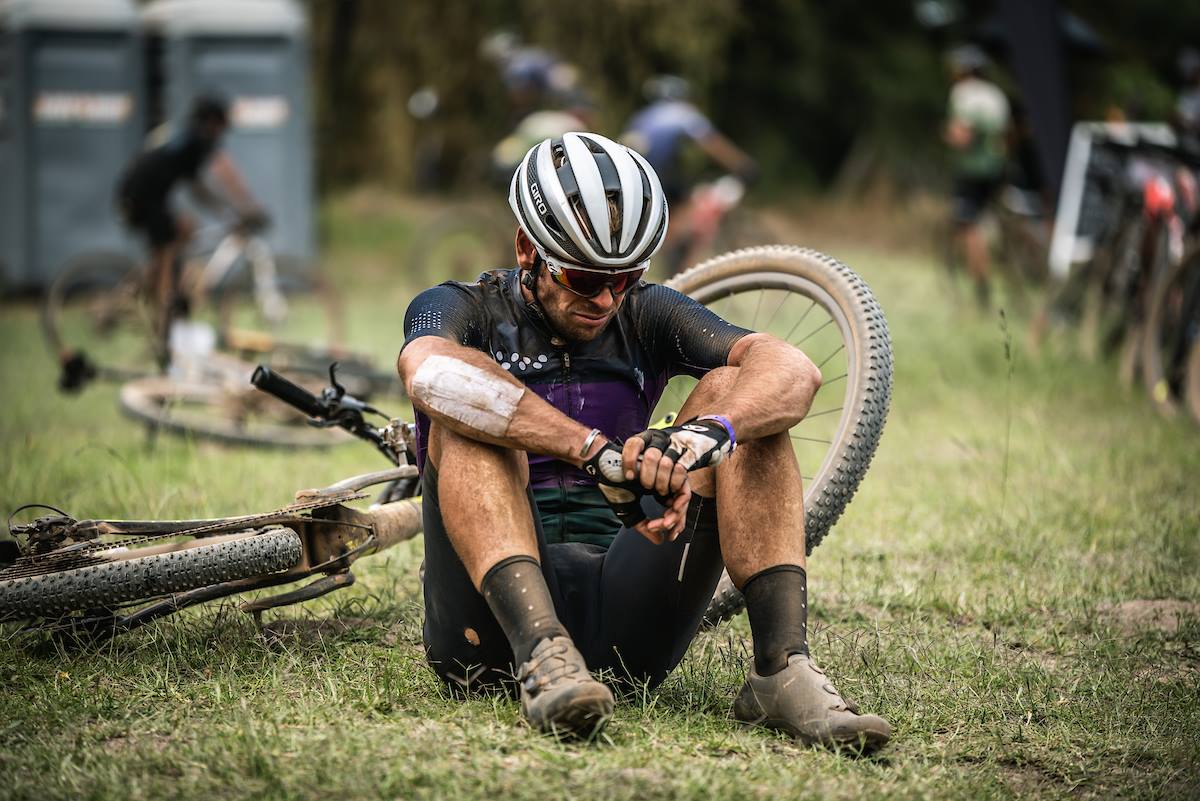
The Absa Cape Epic is a race, not a ride. It’s eight days of pressure, not pleasure. It’s not a point-to-point event, but it is a journey – of discovery. Every single participant at the 2019 Cape Epic, whether he/she finished or not, discovered something new about himself/herself and has a compelling story to tell. Each of 1380 riders from 52 countries that started the event, whether they finished it or not, left the race a little tougher and a lot wiser.
 The Absa Cape Epic has run a rider survey since 2006. We (TREAD) have become obsessed with these stats and collaborate each year with the Cape Epic in publishing them, along with some insight.
Here are all the Cape Epic 2019 rider stats…
Months of preparation
| 3 | 11% |
| 4 | 18% |
| 5 | 16% |
| 6 | 24% |
| 7 | 5% |
| 8 | 5% |
| 9 | 2% |
| 10 | 4% |
| >10 | 15% |
| 6.5 months | Average |
A total of 68% said they followed a prescribed training plan for the 2019 Cape Epic. A total of 24% say they began serious preparation in September 2018 (six months out), 45% fitted in their preparation in less than six months and a total of 31% said their training build-up period was longer than six months.
Training aids
| Power Meter | GPS | HRM | |
| 2019 | 54% | 89% | 89% |
| 2018 | 48% | 91% | 90% |
| 2017 | 42% | 88% | 84% |
| 2016 | 43% | 91% | 86% |
| 2015 | 35% | 86% | 86% |
| 2014 | 30% | 77% | 84% |
| 2013 | 22% | 67% | 84% |
| 2012 | 20% | 54% | 83% |
| 2011 | 18% | 43% | 82% |
| 2010 | 19% | 29% | 86% |
| 2009 | 19% | 26% | 84% |
| 2008 | 18% | 23% | 85% |
| 2007 | 16% | N/A | 85% |
As power measurement has become more cost effective and bicycle riders more enlightened to the benefits of power measurement, power meter usage continues to increase, with more than half the field in 2019 using the measurement during training and/or the race. Yes, all of the above can be measured on one device, and that’s become the norm for most brands like Garmin, Suunto and Wahoo. Every committed Cape Epic participant clearly sees technology-measured performance as his/her companion.

Start and finish stats of complete teams
| Year | All Start | All Finish | % teams DNF |
| 2019 | 690 | 597 | 13.5% |
| 2018 | 672 | 564 | 16.1% |
| 2017 | 666 | 503 | 24.4% |
| 2016 | 648 | 483 | 25.5% |
| 2015 | 624 | 512 | 18% |
| 2014 | 620 | 522 | 15.7% |
| 2013 | 630 | 496 | 21.4% |
| 2012 | 605 | 481 | 20.5% |
| 2011 | 604 | 496 | 18% |
| 2010 | 589 | 445 | 24.5% |
| 2009 | 598 | 503 | 16.1% |
| 2008 | 599 | 435 | 27.4% |
| 2007 | 624 | 468 | 25% |
| 2006 | 466 | 379 | 19.1% |
| Ave | 617 | 492 | 20.4% |
 The 2019 Cape Epic can be remembered for being the Cape Epic with the least number of teams that did not finish (DNF). So far. With 690 teams, it’s also the edition with the most starters; and, at 597, the edition with the highest number of finishers too. This also dropped the average number of teams that DNF since 2006 to 20.4% from 20.9% last year.
As with 2018, there weren’t any excessively hot days, which certainly plays a role in the attrition rate, especially when those hot days are early on in the race, such as in 2017 and 2016. The mid-race time trial stage also allows for an easier day, which gives teams at their limit some recuperation time before tackling the last few stages.
Note: these stats exclude the first two editions (2004 and 2005) as we have no data on those events.
All categories start and finish stats 2019
| 2019 | Team Totals | % of Teams that DNF | Number of Solo Finishers | Total Finishers: Teams + Solo | Total % Finishers: Teams + Solo |
| All Teams Start | 690 | ||||
| All Teams Finish | 597 | 11.44% | 79 | 1273 | 92.24% |
| Men Teams Start | 289 | ||||
| Men Teams Finish | 247 | 14.53% | 36 | 530 | 91.69% |
| Women Teams Start | 18 | ||||
| Women Teams Finish | 15 | 16.66% | 1 | 31 | 86.11% |
| Masters Teams Start | 233 | ||||
| Masters Teams Finish | 209 | 10.31% | 19 | 437 | 93.77% |
| Grand Masters Teams Start | 97 | ||||
| Grand Masters Teams Finish | 84 | 13.41% | 13 | 181 | 93.29% |
| Mixed Teams Start | 53 | ||||
| Mixed Teams Finish | 42 | 20.76% | 10 | 94 | 88.67% |
 % of Teams that DNF
| 2017 | 2018 | 2019 | |
| All | 24.4% | 16.1% | 13.5% |
| Men | 23.3% | 13.2% | 11.4% |
| Women | 14.1% | 25% | 16.7% |
| Masters | 15.3% | 24.8% | 10.3% |
| Grand Masters | 20.3% | 29.7% | 13.4% |
| Mixed | 20.5% | 27.5% | 20.8% |
% of total finishers – Teams & Solo
| 2017 | 2018 | 2019 | |
| All | 84.1% | 90.6% | 92.2% |
| Men | 85.9% | 92.5% | 91.7% |
| Women | 92.6% | 83.3% | 86.1% |
| Masters | 84.1% | 90.8% | 93.8% |
| Grand Masters | 79.7% | 89.2% | 93.3% |
| Mixed | 77.5% | 87.7% | 88.7% |
What’s very evident here is that the 2019 Absa Cape Epic claimed far fewer teams than the 2018 edition did. As pointed out earlier, the 2017 edition was one of the highest DNF rates, while the 2019 edition was one of the lowest.
The only category that showed a higher DNF rate over last year was the Women’s division. Speaking of the Women’s division, this remains a very small category, despite the organisers decision to pay equal prize money since 2014. At the time, it was the biggest prize purse all disciplines of women’s cycling.
General statistics after 2019
Most stage wins
Men:
38 Christoph Sauser (SUI)
20 Burry Stander (RSA)
17 Karl Platt (GER)
13 Jaroslav Kulhavy (CZE)
10 Nino Schurter (SUI)
12 Bart Brentjens (NED)
6 Mannie Heymans (NAM), Henrique Avancini (BRA), Manuel Fumic (GER)
Women:
31 Annika Langvad (DEN)
17 Hanlie Booyens (RSA), Ariane Lüthi (SUI)
14 Sharon Laws (GBR)
12 Esther Suss (SUI)
9 Hannele Steyn (RSA)
8 Anke Moore (RSA), Yolande de Villiers (RSA) and Sally Bigham (GBR)
7 Sabine Spitz (GER), 7 Kate Courtney (USA), 7 Anna van der Breggen (NED)
Mixed:
18 Nico Pfitzenmaier (RSA)
15 Ariane Lüthi (SUI), Erik Kleinhans (RSA)
10 Barti Bucher (SUI), Paul Cordes (RSA), Yolande Speedy (RSA)
8 Thomas Frischknecht (SUI), Jenny Rissveds (SWE)
6 Sebastian Stark (GER), Laura Stark (GER)
Masters:
26 Bart Brentjens (NED)
25 Abraao Azevedo (BRA)
18 Shan Wilson (RSA)
17 Andrew McLean (RSA)
14 Linus van Onselen (RSA)
13 Doug Brown (RSA)
12 Nico Pfitzenmaier (RSA)
11 Carsten Bresser (GER), Udo Boelts (GER)
10 Robert Sim (RSA)
6 Joaquim Rodrigues (ESP) ,Jose Hermida (ESP)
Grandmasters
32 Heinz Zoerweg (AUT)
27 Barti Bucher (SUI)
13 Robert Sim (RSA)
13 Udo Boelts (GER)
8 Andrew McLean (RSA), Bart Brentjens (NED), Abraao Azevedo (BRA)
Africans (and South Africans) in the Cape Epic overall top 10 since 2006:
2019 – 2 (2 SA)
2018 – 0
2017 – 3 (3 SA)
2016 – 3 (3 SA)
2015 – 8 (8 SA)
2014 – 5 (5 SA)
2013 – 4 (4 SA)
2012 – 8 (8 SA)
2011 – 3 (1 SA)
2010 – 5 (5 SA)
2009 – 5 (3 SA)
2008 – 6 (5 SA)
2007 – 4 (3 SA)
2006 – 10 (6 SA)
South African Cape Epic overall stage winners – men:
20 Burry Stander
4 Kevin Evans
3 Shan Wilson
3 David George
3 Philip Buys
2 Matthys Beukes
2 Brandon Stewart
1 Jacques Rossouw
1 Gert Heyns
1 Ben-Melt Swanepoel
1 Richard Beswick
Multiple overall winners:
Men
5 Christoph Sauser (SUI) 2006, 2011, 2012, 2013, 2015
5 Karl Platt (GER) 2004, 2007, 2009, 2010, 2016
3 Stefan Sahm (GER) 2007, 2009, 2010
3 Jaroslav Kulhavy (CZE) 2013, 2015, 2018
2 Burry Stander (RSA) 2011, 2012
2 Roel Paulissen (BEL) 2005, 2008
2 Nino Schurter (SUI) 2017, 2019
Women
5 Annika Langvad (DEN) 2014, 2015, 2016, 2018, 2019
3 Ariane Kleinhans (SUI) 2014, 2015, 2016
2 Hanlie Booyens (RSA) 2004, 2009
2 Sharon Laws (GBR) 2004, 2009
2 Sally Bigham (GBR) 2011, 2012
2 Esther Süss (SUI) 2012, 2017

South Africans that have won Cape Epic titles:
Men: Burry Stander x 2
Women: Hanlie Booyens x2, Zoe Frost, Hannele Steyn, Anke Moore, Yolande de Villiers, Karien van Jaarsveld, Yolande Speedy
Mixed: Yolande Speedy/Paul Cordes x2, Erik Kleinhans x 2, Nic White/Anke Moore
Masters: Doug Brown x 3, Andrew McLean x 2, Frank Soll, Duncan English, Fred Coleske, Linus van Onselen, Geddan Ruddock, Shan Wilson, Damian Booth
Grand Masters: Robert Sim x 2, Andrew Mclean
The Last Lions
Only four riders have completed every edition of the Cape Epic (16 in total). They are Hannele Steyn (53), Mike Nixon (60), John Gale (50) and Craig Beech (46) – all South Africans.
Did you miss our Absa Cape Epic 2019 Gear Stats analysis? Here you go.


