While mountain biking has become hugely popular, there remains limited data on one of South Africa’s most popular forms of sport/exercise. It’s been an objective of ours to change this through regular TREAD surveys. Here are stats and analysis with some comparison to 2017 on the bicycles at the KAP Sani2c, South Africa’s largest stage race.
Our survey had a total of 566 responses, which from a total race entry number of 4060 is an ideal sample size for 95% confidence level and 5% margin for error.Here are the results of the bicycle-related questions and our analysis.
(Viewing this on a mobile device? Best viewed in landscape)
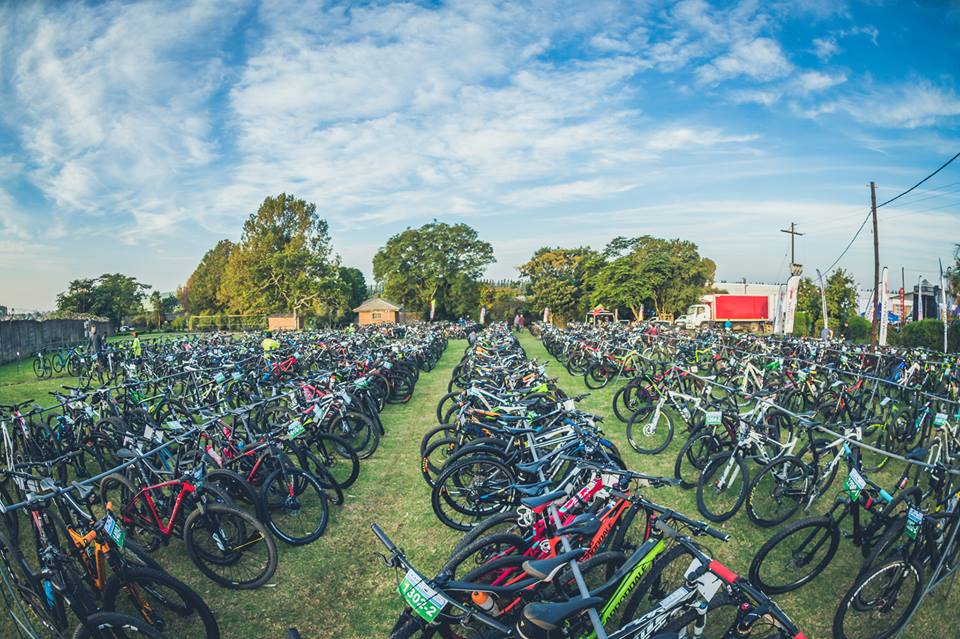
Bike brand
| 2018 | % | 2017 | % |
| Specialized | 24.41% | Specialized | 26.47% |
| SCOTT | 19.53% | SCOTT | 14.32% |
| Cannondale | 8.98% | Giant | 11.07% |
| Giant | 7.81% | Cannondale | 6.73% |
| TREK | 7.03% | Merida | 6.73% |
| Merida | 6.25% | TREK | 5.41% |
| Santa Cruz | 4.68% | Momsen | 4.81% |
| Momsen | 3.32% | Santa Cruz | 3.61% |
| Silverback | 2.92% | Pyga | 3.24% |
| Pyga | 2.14% | Silverback | 2.16% |
| Yeti | 1.36% | Yeti | 1.8% |
| Rocky Mountain | 1.17% | BMC | 1.68% |
| Cube | 0.97% | Rocky Mountain | 1.20% |
| KTM | 0.97% | Cube | 0.96% |
| Norco | 0.97% | Lapierre | 0.84% |
| Other | 7.49% | Other | 8.9% |
With almost a quarter of the field, Specialized remains the most popular bicycle brand. But it did lose two percent over 2017’s survey figures. With a more than 5% jump, SCOTT was the biggest climber in terms of Sani2c market share, with Cannondale and TREK both climbing in the rankings and market share compared to last year.
With just over 3% loss, the brand that had the biggest drop compared to 2017 was Giant. South African brands, Momsen, Silverback and Pyga remain in the top 10, with Santa Cruz losing a bit of market share, but moving up from eight to seventh. Rocky Mountain and Yeti remain fairly stable, with Canadian brand Norco and Austrian brand KTM matching Cube to move into the top 15.
Age of bike
| 2018 | 2017 | |
| It’s a new bike | 9.62% | 7.87% |
| I bought it in the last year | 20.33% | 21.55% |
| About 2 years | 20.15% | 26.11% |
| About 3 years | 18.69% | 18.81% |
| About 4 years | 14.16% | 12.43% |
| About 5 years | 10.53% | 8.78% |
| About 6-9 years | 6.35% | 3.65% |
| 10 years or older | 0.18% | 0.80% |
We thought 2017 was a tough economic year, but 2018 now has the gold medal… Despite that, almost 30% purchased their bike in the past year ahead of KAP Sani2c – similar to 2017. How often should you buy a new bike? There’s no hard and fast rule and obviously your financial status is a major factor, but we reckon you shouldn’t hang onto a bike for more than three years. Had your current bike for more than three years? Treat yourself! You deserve it…
Bicycle cost
| 2018 | 2017 | |
| Under R10000 | 1.45% | 1.48% |
| R10000–R14999 | 2.54% | 3.76% |
| R15000–R19999 | 3.99% | 4.79% |
| R20000–R24999 | 5.26% | 6.27% |
| R25000–R29999 | 6.72% | 8.55% |
| R30000–R34999 | 7.62% | 9.92% |
| R35000–R39999 | 9.07% | 9.12% |
| R40000–R44999 | 8.89% | 8.21% |
| R45000–R49999 | 6.90% | 7.07% |
| R50000–R54999 | 6.17% | 6.27% |
| R55000–R59999 | 7.26% | 4.33% |
| R60000–R64999 | 4.36% | 2.96% |
| R65000–R69999 | 4.90% | 2.96% |
| R70000–R74999 | 3.99% | 2.62% |
| R75000–R79999 | 4.17% | 3.19% |
| R80000–R84999 | 3.09% | 3.65% |
| R85000–R89999 | 2.00% | 3.76% |
| R90000–R94999 | 1.81% | 2.05% |
| R95000–R99999 | 2.18% | 1.48% |
| R100000–R109999 | 2.18% | 2.39% |
| R110000–R119999 | 0.73% | 1.60% |
| R120000–R129999 | 2.00% | 1.25% |
| R130000 or more | 2.72% | 2.28% |
The average bike value for 2018 is R49 545, a little down on the R51 408 from 2017. For reference the average bike value at the 2018 Absa Cape Epic was R97 145. Interestingly 36.65% paid less than R40 000 for their bike in 2018 compared to 44.89% last year.
Frame type
| 2018 | 2017 | |
| Hardtail | 9.16% | 13.56% |
| Full suspension | 90.84% | 86.44% |
In stage races, where comfort is essential, the hardtail is becoming increasingly rare, as can be seen in this statistic.
Wheel size
| 2018 | 2017 | |
| 26-inch | 1.37% | 3.06% |
| 27.5-inch | 5.09% | 6.36% |
| 29-inch | 93.54% | 90.58% |
The 29-inch wheel continues to dominate. Hard to believe that until 2010, the entire field would have been on 26-inch wheels.
Number of chainrings
| 2018 | 2017 | |
| Three | 9.55% | 13.34% |
| Two | 38.60% | 47.58% |
| One | 51.85% | 39.08% |
No real surprise here. Single chainrings with 11 or 12 gears offer a wide gear-ratio range that suits most stage racers. They’re also simpler and a little lighter.
Drivetrain status
| 2018 | 2017 | |
| I am very happy with 2/3 chainrings | 31.19% | 47.63% |
| I bought my bike with a single chainring drivetrain | 36.45% | 26.64% |
| I recently changed to a single chainring drivetrain | 16.37% | 13.98% |
| I plan to change to a single chainring drivetrain | 15.98% | 13.74% |
The simplification of the drivetrain isn’t only a hot discussion topic, it’s a compelling reason to upgrade from multi-chainring or even buy a new bike.
Bike service status
| 2018 | 2017 | |
| My bike had a major service | 55.17% | 52.53% |
| My bike had a minor service | 26.71% | 33.57% |
| My bike didn’t need a service | 12,87% | 10.37% |
| My bike is brand new | 5.26% | 3.53% |
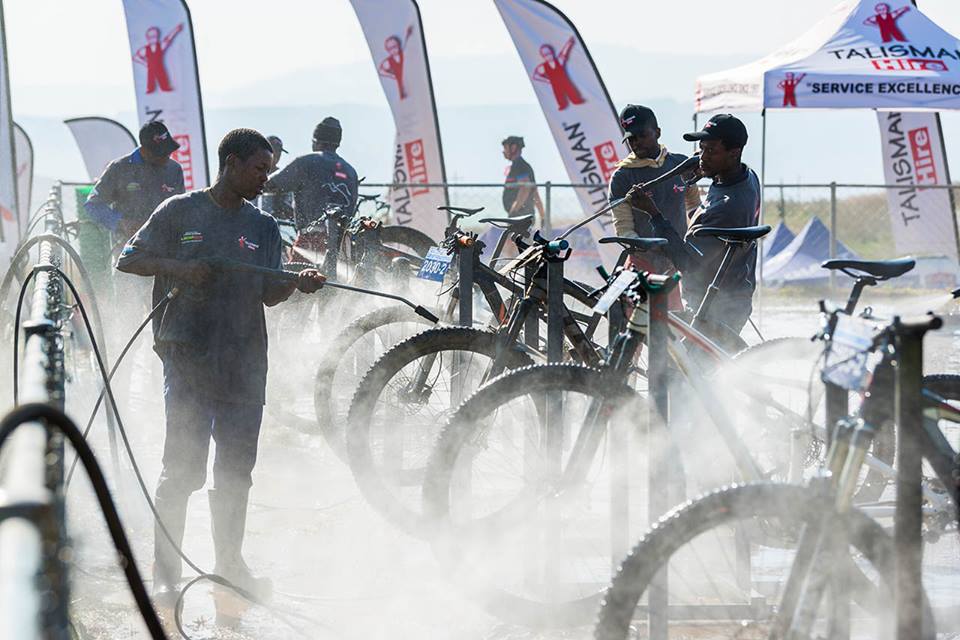
The unpredictable nature of mountain biking means having your bike serviced (if it isn’t new) will reduce the risk of something going wrong during your race. Clearly the majority of KAP Sani2c participants are aware of this…
Major component brand
| 2018 | 2017 | |
| SRAM | 32.16 | 27.76% |
| Shimano | 50.88% | 53.76% |
| A combination of SRAM and Shimano | 16.57% | 18.12% |
| Other | 0.39% | 0.35% |
Shimano remains the more dominant component brand at this event, but the Japanese brand experienced almost an 8% market share loss to rival SRAM. The increased number of single chainring drivetrains is no doubt the reason for this, with Shimano only launching its 1×12 drivetrain in late May, after the completion of the 2018 KAP Sani2c.
Keen to participate in this iconic event? Entries for the 2019 edition are open. Online entry and more info here: https://sani2c.co.za
Did you miss Parts 1 and 2 of the 2018 KAP Sani2c Rider Survey? Here are the links:
2018 KAP Sani2c Rider Stats: https://www.treadmtb.co.za/kap-sani2c-riders-stats-the-2018-reveal/
2018 KAP Sani2c Gear Stats: http://www.treadmtb.co.za/gear-choice-at-the-2018-kap-sani2c-all-the-stats/


