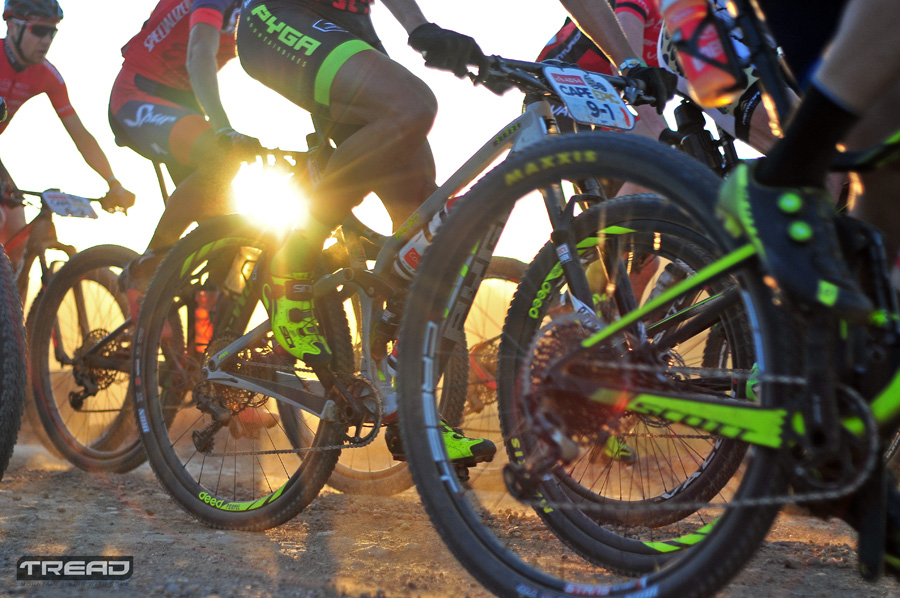
The annual Absa Cape Epic is considered by many to be the ultimate proving ground for bikes, gear and riders. It’s not only the distance, the terrain, the conditions and the weather; it’s the pressure that makes the bike stats from this race relevant. Everything performs differently under pressure and there’s no greater pressure over such a long period of world-class mountain bike racing than the Cape Epic. Here’s our summary and analysis of the 2017 bike stats.
Compiled by Sean Badenhorst and Shikara Nel
Photos by Dino Lloyd
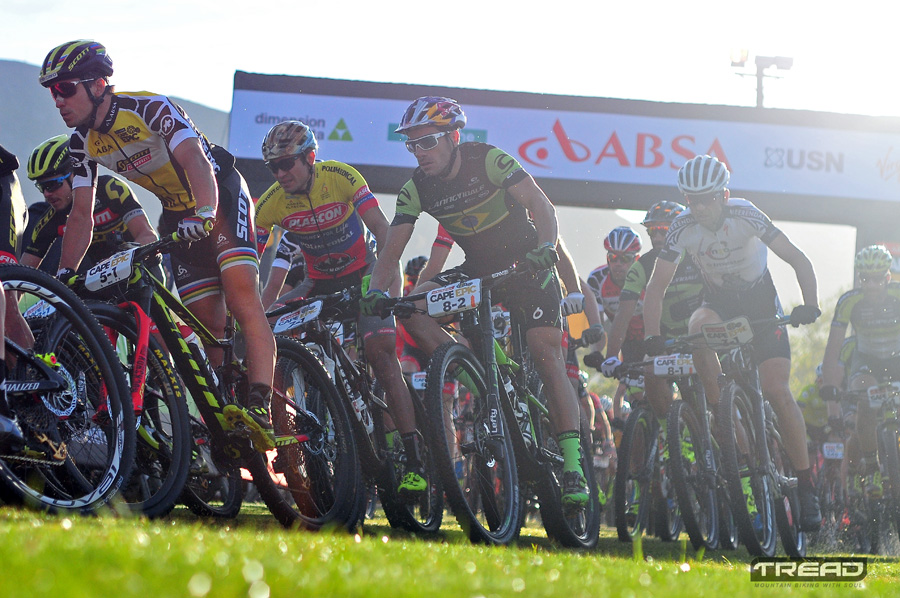
Photo: Dino Lloyd/Tread MTB
Fewer entrants bought new bikes for this year’s Absa Cape Epic but the average bike value shot up remarkably – to more than R90 000 a bike! This is according to the annual Cape Epic rider survey. It’s an optional survey and this year 1141 of the 1332 entrants took it. That’s 86% of the field and a very good sample size.
A total of 52% of the entrants bought a new bike in the 12 months leading up to the 2017 Cape Epic. This is down on the 59% from 2016 and the 65% that did so in 2015.
Of that 52%, a total of 20% were South African and the rest (32%) international riders. This is the first time we’ve been given the SA/International split so don’t have any historical reference for this split.
A total of 89% say their bike cost more than R50 000. This is up from 80% in 2016 and 59% in 2015. And of 44% say their bike cost them more than R100 000, up from 24% in 2016.
The average bike value at the 2017 Cape Epic was R95 661-70. No, that’s not an error! Ninety-five thousand six hundred and sixty one Rand and seventy cents on average per bike.
Average bike value since 2007
| 2007 | 2008 | 2009 | 2010 | 2011 | 2012 | 2013 | 2014 | 2015 | 2016 | 2017 |
| R28001 | R30659 | R34215 | R35898 | R37510 | R40349 | R42244 | R44937 | R60752 | R76052 | R95 662 |
| R7.27=$1 | R8.19=$1 | R9.72=$1 | R7.39=$1 | R6.84=$1 | R7.69=$1 | R9.24=$1 | R10.58=$1 | R12.12=$1 | R14.71=$1 | R13.29=$1 |
We include the Rand=US Dollar rate at 31 March for each year (the Cape Epic month) to add some perspective. Proportionately, in 2017, the Rand was almost 100% weaker than it was in 2007, but average bike value has more than tripled.
Breakdown of bike value at the 2017 Cape Epic
| Price bracket | Percentage |
| Under R30000 | 0% |
| R30000–R40000 | 3.76% |
| R40000–R50000 | 5.78% |
| R50000–R60000 | 7.36% |
| R60000–R70000 | 9.64% |
| R70000–R80000 | 8.67% |
| R80000–R90000 | 9.90% |
| R90000–R100000 | 10.78% |
| R100000–R110000 | 10.51% |
| R110000–R120000 | 7.36% |
| R120000–R130000 | 8.76% |
| Over R130000 | 17.44% |
No bikes under R30 000 and 17.44% over R130 000. That’s a telling statistic, especially when you consider that only 52% bought new bikes in the year leading up to the 2017 Cape Epic – a year when bike prices have been notably higher, particularly in South Africa and largely due to the weakened Rand.
Note that the 2016 Cape Epic survey would have included 2015 purchasing patterns, before the Rand hit it’s first big wobble on 9 December 2015.
We noticed an exceptionally high percentage of bikes with SRAM Eagle drivetrains and Shimano Di2 electronic shifting (we only saw XTR level ourselves). These alone raise the value of a bike by at least R25 000 and upwards.
Look, there were bikes that would have cost under R30 000. For example we saw a number of riders in the Exxaro Development Category on aluminium hardtails. But it’s unlikely they took the online survey.
The most expensive bike we came across was the FRM Anakin Cape Cobra of Team Kansai Plascon’s Leonardo Paez. The super-light carbon fibre bike is handmade in Italy is limited to 50 units and includes the SRM PC8 power meter system which has the rider’s name laser etched. The value or Paez’s bike is €16 000. At R14.68 to €1 (10 April 2017) that’s R234 880! Without the SRM power meter, the bike costs €13 000 or R190 840. At 50 units we could argue this is as close to a factory prototype model as possible.

Photo: Dino Lloyd/Tread MTB
Most popular bike brands overall for the last three years
| 2015 | 2016 | 2017 | |||
| Specialized | 36% | Specialized | 36% | Specialized | 32% |
| SCOTT | 13% | SCOTT | 12% | SCOTT | 14% |
| Cannondale | 9% | Cannondale | 10% | Cannondale | 12% |
| Airborne | 4% | Santa Cruz | 5% | Trek | 6% |
| TREK | 4% | Airborne | 5% | Santa Cruz | 4% |
| Santa Cruz | 4% | TREK | 4% | Giant | 4% |
| Giant | 4% | Giant | 4% | BMC | 3% |
| Merida | 3% | BMC | 3% | Rocky Mountain | 2% |
| BMC | 3% | Momsen | 3% | Merida | 2% |
| Rocky Mountain | 2% | Rocky Mountain | 2% | Momsen | 1% |
| Momsen | 2% | Merida | 1% | Pyga | 1% |
| Other | 19% |
Most popular brands history
| ’08 Tot | ’08 SA | ’09 Tot | ’09 SA | ’10 Tot | ’10 SA | ’11 Tot | ‘11SA | ’12 Total | ’12 SA | ’13 Total | ’13SA | ’14 Total | ’14 SA | ’15 Tot | ’15 SA | ’16 Tot | ’16 SA | ’17 Tot | ’17 SA | |
| Specialized | 17% | 17% | 18% | 18% | 19% | 19% | 18% | 17% | 23% | 21% | 23% | 23% | 29% | 30% | 36% | 40% | 36% | 35% | 32% | 33% |
| SCOTT | 10% | 8% | 12% | 12% | 10% | 8% | 11% | 11% | 11% | 12% | 11% | 12% | 15% | 17% | 14% | 13% | 12% | 12% | 14% | 12% |
| Cannondale | 5% | 5% | 6% | 4% | 6% | 4% | 6% | 5% | 7% | 7% | 7% | 7% | 10% | 10% | 9% | 7% | 10% | 11% | 12% | 13% |
| TREK | 4% | 4% | 4% | 3% | 5% | 5% | 7% | 6% | 7% | 6% | 7% | 8% | 5% | 6% | 4% | 3% | 4% | 3% | 6% | 5% |
| Santa Cruz | 2% | 3% | 2% | 2% | 3% | 3% | 3% | 3% | 5% | 5% | 5% | 5% | 3% | 4% | 4% | 6% | 5% | 7% | 4% | 7% |
| Giant | 18% | 24% | 15% | 20% | 12% | 17% | 11% | 16% | 11% | 13% | 11% | 13% | 6% | 7% | 4% | 6% | 4% | 5% | 4% | 4% |
| BMC | 1% | 1% | 1% | 0% | 1% | 1% | 1% | 1% | 1% | 1% | 3% | 1% | 3% | 2% | 3% | 3% | 4% | 3% | ||
| Rocky Mountain | 2% | 1% | 1% | 1% | 1% | 1% | 1% | 0% | 1% | 1% | 1% | 1% | 2% | 2% | 2% | 2% | 2% | 3% | 2% | 3% |
| Merida | 8% | 10% | 8% | 10% | 8% | 10% | 5% | 6% | 5% | 4% | 4% | 5% | 3% | 3% | 1% | 1% | 2% | 3% | ||
| Momsen | 3% | 4% | 2% | 3% | 3% | 4% | <1% | 1% | ||||||||||||
| Pyga | <1% | 1% |
Overall, Cannondale, SCOTT and TREK all saw increases of 2% over 2016, while Specialized had a 4% drop, but remains by far the most popular brand at the Cape Epic. Interestingly, both Cannondale (Scalpel) and SCOTT (Spark) launched their new dual sus marathon models in 2016. We know that in South Africa, Cannondale enjoyed a good sales year, partly due to sales of the previous Scalpel model, selling at ‘reduced to clear’ pricing and partly due to having such good stock availability of the new Scalpel, at a time when other brands didn’t have high-end marathon model stock, which no doubt led to a number of Cannondale conversions.
TREK’s increase from a South African perspective (3-5%) is no doubt due to the brand’s shift in strategy to managing it’s own brand in the country with high levels of stock availability on it’s Top Fuel marathon model.
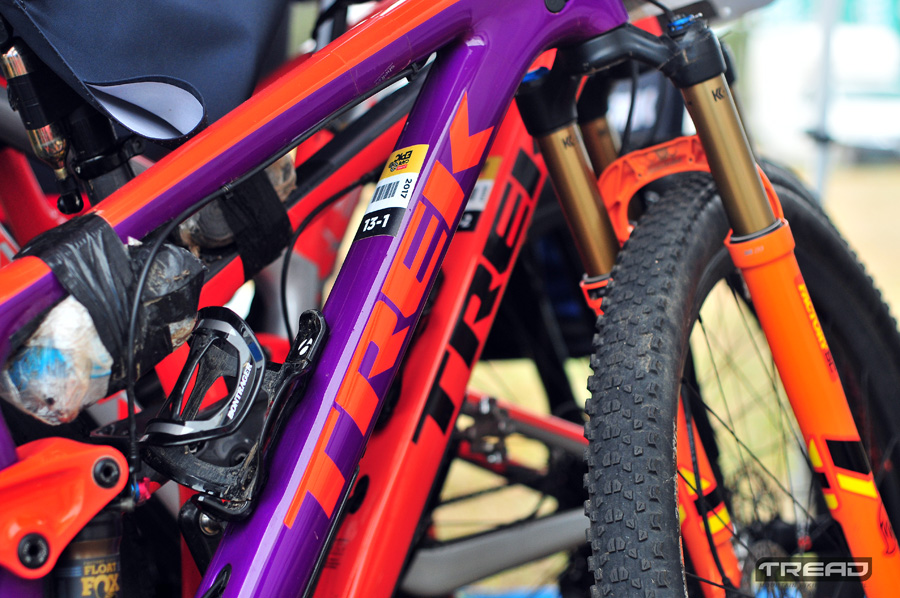
Photo: Dino Lloyd/Tread MTB
Interestingly, the top three brands – Specialized, SCOTT and Cannondale, were the only bike brands to win stages in the men’s race in 2017, with Cannondale and Specialized each winning two and SCOTT winning four.
Merida remained relevant by turning it’s 1% of 2016 into 2% this year (and from 1% to 3% among the South African entrants). After missing the 29-inch dual sus ‘purple patch’, Merida recently relaunched its once highly successful Ninety-Six model in the 29-inch wheel size and will no doubt begin clawing back market share among the value-minded over time.
Santa Cruz dropped this year from 5% total to 4% but remained stable at 7% of the South African entrants, while Rocky Mountain and Giant remained fairly static, with BMC experiencing small growth overall.
Among the South African brands, Momsen dropped from last year, while Pyga achieved 1% of the local entry total.
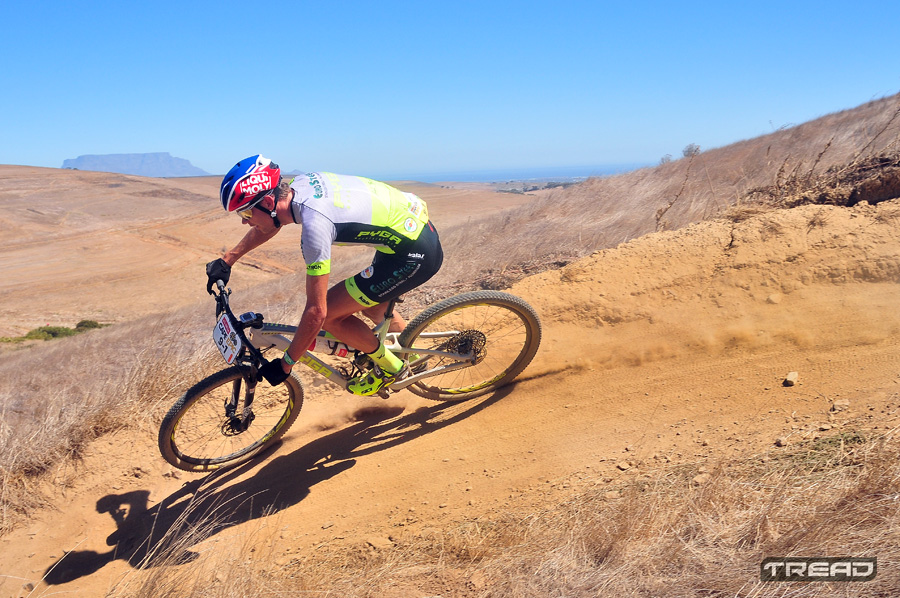
Photo: Dino Lloyd/Tread MTB
Hardtail vs Dual Suspension
| 2007 | 2008 | 2009 | 2010 | 2011 | 2012 | 2013 | 2014 | 2015 | 2016 | 2017 | |
| Hardtail | 30% | 26% | 23% | 20% | 22% | 31% | 24% | 21% | 14% | 7.4% | 10% |
| Dual sus | 69% | 74% | 77% | 80% | 77% | 69% | 75% | 79% | 85% | 92.4% | 90% |
| Rigid | 0.2% |
Dual suspension remains the most popular frame type by far. This really isn’t surprising. The comfort and control are worth the investment in our opinion. Historically, the dip in dual sus growth (2011–2013) is as a result of the introduction of 29-inch wheels, with most brands taking a while to perfect their dual sus frame designs to accommodate the bigger wheels.
Wheel size
| 2011 | 2012 | 2013 | 2014 | 2015 | 2016 | 2017 | |
| 26 inch | 78% | 36% | 17% | 8% | 6% | 5.3% | No data |
| 29 inch | 22% | 64% | 82% | 90% | 91% | 92% | No data |
| 27.5 inch (650b) | 0% | 0% | 1% | 2% | 3% | 2.4% | No data |
| Fat bike | 0.3% | No data |
The Cape Epic didn’t ask this question this year. They said that it hasn’t changed much lately so they didn’t think it was relevant. We’ve left it in this year’s analysis article because it’s confirmation as to just how significant an impact 29-inch wheels have had on mountain biking in general (especially in South Africa) and the Cape Epic in particular.
Photo: Dino Lloyd/Tread MTB
Photo: Dino Lloyd/Tread MTB
Bike brands of final GC top 10 2017:
1st SCOTT
2nd Specialized
3rd Centurion
4th FRM/Rocky Mountain
5th Cannondale
6th SCOTT
7th Pyga
8th Canyon
9th Centurion
10th Merida/Bianchi
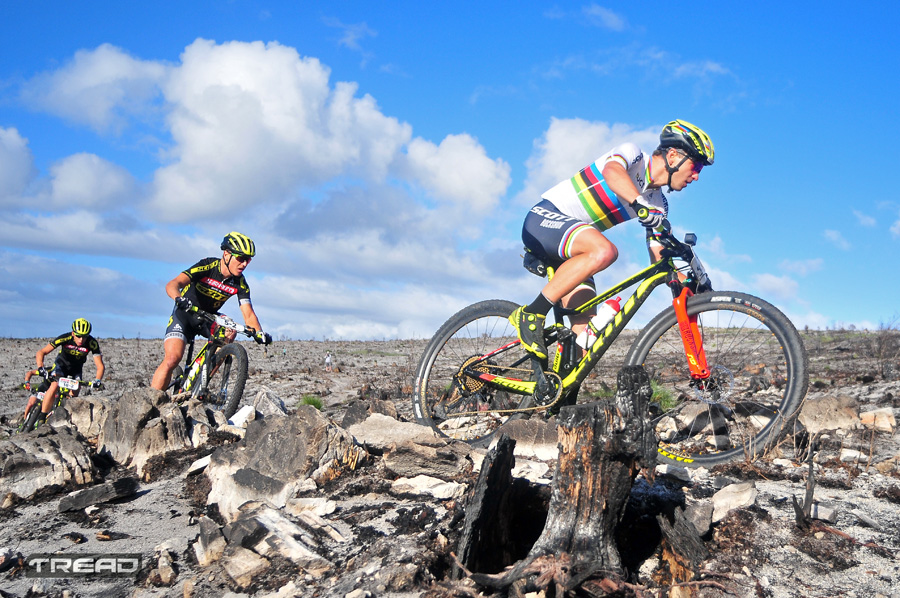
Photo: Dino Lloyd/Tread MTB
Back in the top 10 after an absence last year are SCOTT, Specialized and Merida. FRM makes its first appearance in the Cape Epic top 10, while Rocky Mountain has its best finish since Karl Platt won the inaugural event on a Rocky Mountain in 2004.
Centurion, a German bike brand, enjoyed a successful 2017 with both its teams in the top 10, while Pyga made it’s first appearance.
All rights reserved.


