The Absa Cape Epic is an eight-day race that challenges the rider completely – mentally, emotionally and physically. It’s also a test of ‘teammateship’, where empathy and support are required. And significantly, it’s also a test of bicycles and gear. Gear choice is essential in ensuring a Cape Epic passage that lowers the risk of mechanical delays, including tyres, drivetrains and more, as can be seen in Part 2 of the 2018 Absa Cape Epic Rider Survey, brought to you Maxxis Tyres and Rush Sports.
Of the 1 344 riders that entered the 2018 Cape Epic, a total of 1 223 took the rider survey. That’s 91%, which is an exceptionally large sample size. Here’s how their gear choice looked…

Tyre choice
| Tyre brand | 2017 | 2018 |
| Maxxis | 31% | 43% |
| Schwalbe | 27% | 22% |
| Vittoria | 10% | 14% |
| Continental | 16% | 12% |
| Bontrager | 6% | 4% |
| Mitas | 4% | 2% |
| Vredestein | 1% | 1% |
| Michelin | 1% | 1% |
| Kenda | 1% | 0.5% |
| WTB | 0.5% | |
| Other | 3% | 2% |
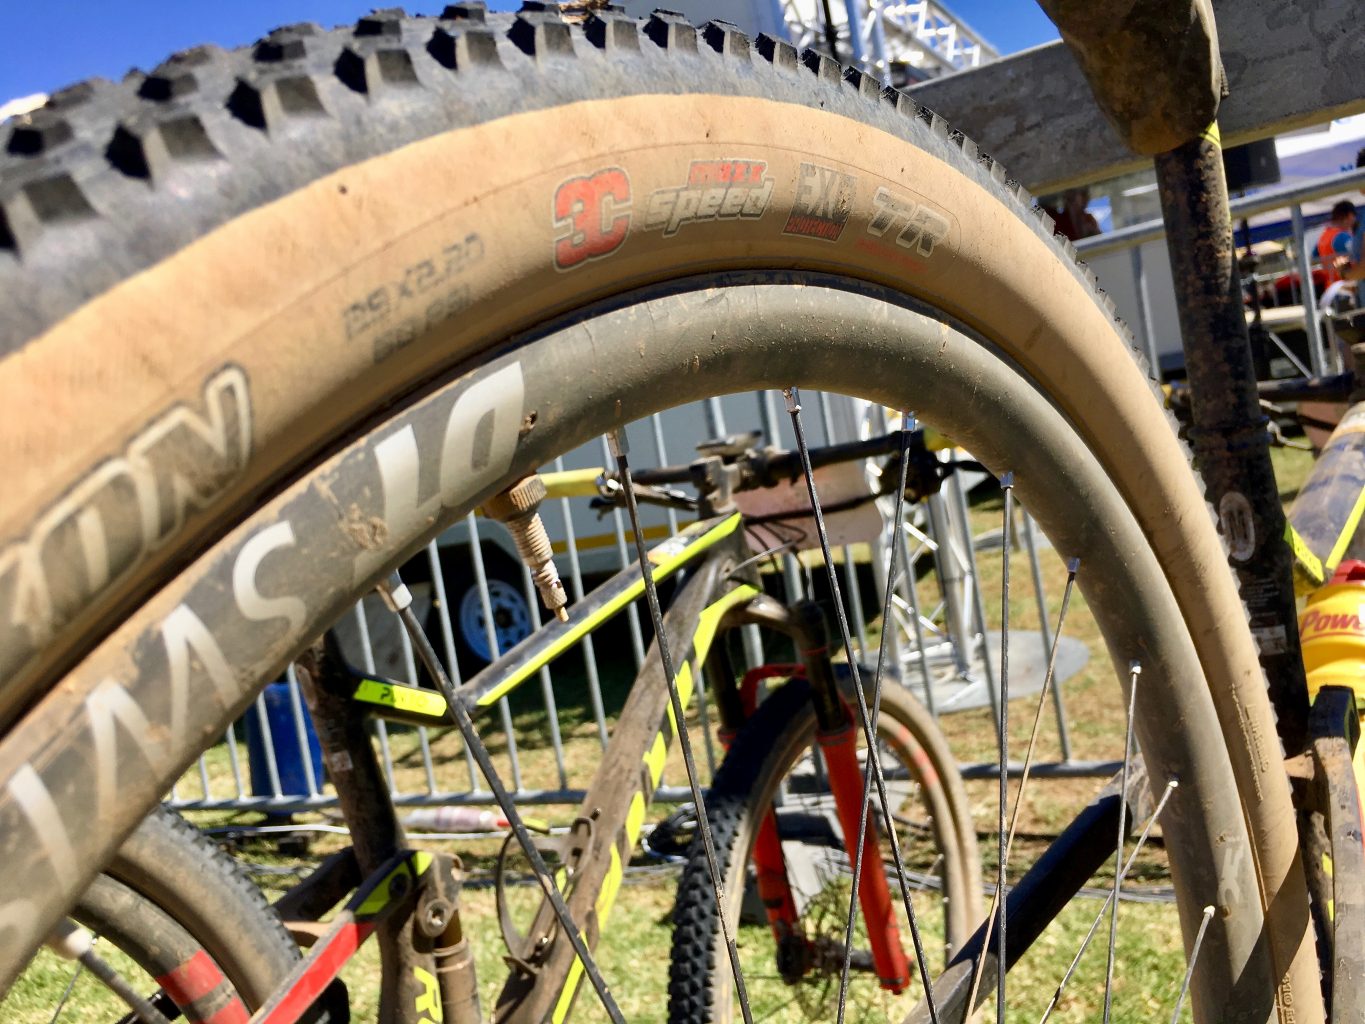
One thing committed mountain bikers can discuss in passionate detail is tyre choice! It’s actually one of the most important decisions you can make when preparing for an event like the Absa Cape Epic because tyre drama is a constant threat to mountain bikers, but especially so in a rugged-terrain region like the Western Cape.
While the modern version of the event covers a much lower percentage of hostile terrain than the early years, there are still sections of the route that include stony or rocky surfaces where the risk of tyre damage is raised.
And even for the large sections of the route that now cover established mountain biking trails, riders with limited experience are less adept at choosing smoother lines, as are riders overcome with fatigue, both leading to a higher risk of tyre damage.

Photo by Nick Muzik/Cape Epic/SPORTZPICS
After holding a fairly slim lead over Schwalbe in 2017, Maxxis has shot to a dominant 43%! Another climber, although not quite as significant, is Vittoria, moving for 10% in 2017 to 14% in 2018. WTB made an appearance in the top 10 this year, just; but falling this year were Schwalbe by 5%, Continental by 4% and Bontrager and Mitas, both by 2%.
Curiously, Specialized tyres were used by both Men and Women’s winners, but don’t even reach 0.5%…
Component split
| Shimano | SRAM | Other | |
| 2007 | 61% | 36% | 3% |
| 2008 | 57% | 41% | 2% |
| 2009 | 57% | 41% | 2% |
| 2010 | 47% | 51% | 2% |
| 2011 | 46% | 53% | 1% |
| 2012 | 45% | 55% | 0% |
| 2013 | 51% | 49% | 0% |
| 2014 | 50% | 49% | 1% |
| 2015 | 44% | 55% | 1% |
| 2016 | 44% | 55% | 1% |
| 2017 | 44% | 56% | 0% |
| 2018 | 29% | 70% | 1% |
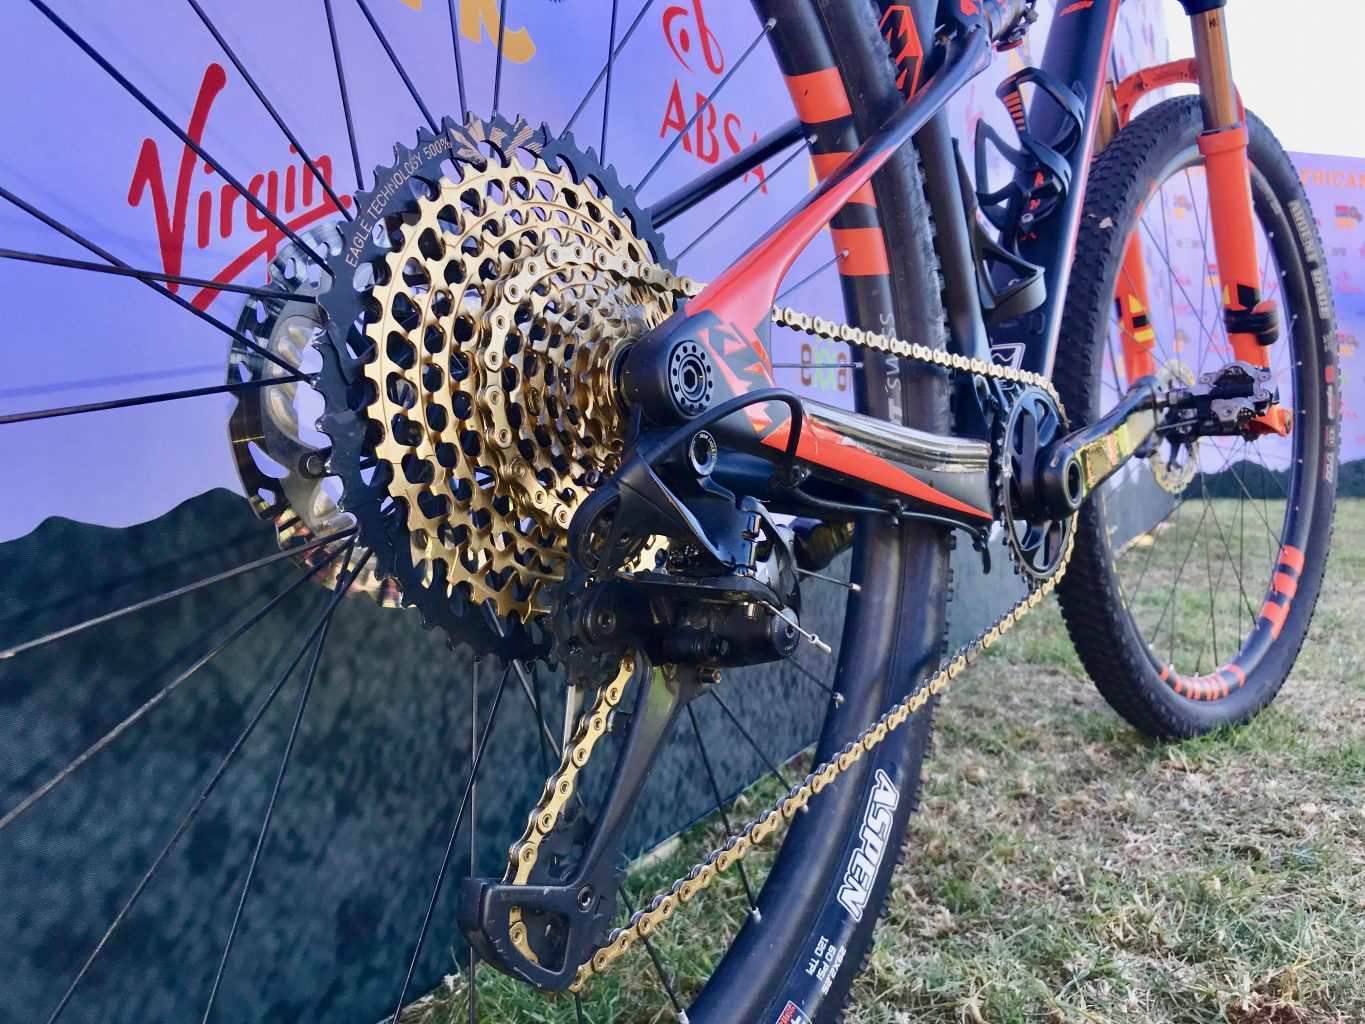
After three years at a fairly constant 55/56%, SRAM shot up to 70% in 2018! This is obviously due to the success of the SRAM’s 1×12 drivetrain, which has virtually consigned the front derailleur to the history books in the committed marathon and stage-racing market.
At the time of writing, Shimano had just launched its own 1×12 drivertrain, but only at XTR level. It’s unlikely the Japanese brand is going to pull back too much market share among Cape Epic participants in the coming year after SRAM’s impressive head start in this area.
Consider the swing since 2007 – Shimano’s Cape Epic participant market-share has halved, while SRAM’s has doubled!

Drivetrain configuration
| 2016 | 2017 | 2018 | |
| Single chainring | 49% | 67% | 81% |
| Double chainring | 48% | 30% | 17% |
| Triple chainring | 3% | 3% | 2% |
The launch of SRAM’s 1×12 has revolutionised the marathon and stage-race market’s drivetrain choice and it shows in all stage race survey stats over the past year, with a significant jump from 49% two years ago to 81% at the Cape Epic this year.
Dropper seatpost
| 2017 | 2018 | |
| Yes | 17% | 21% |
| No | 83% | 79% |
This question was introduced last year and while dropper posts won’t have the same impact as 29-inch wheels and 1×12 drivetrains, they’re sure to increase each year as the product becomes more available/affordable.
There’s no question that a dropper seatpost improves rider control through fast corners and on descents – even more so for less-skilled riders who struggle with managing their centre of gravity. As Cape Epic entrants become more discerning, there’s sure to be a bigger shift in this area, with a 4% movement in the past year.
Eyewear
| 2012 | 2013 | 2014 | 2015 | 2016 | 2017 | 2018 | |
| Oakley | 36% | 40% | 45% | 49% | 51% | 55% | 57% |
| Rudy Project | 24% | 25% | 24% | 21% | 20% | 14% | 15% |
| adidas | 11% | 10% | 8% | 12% | 12% | 10% | 10% |
| UVEX | 2% | 2% | |||||
| POC | 2% | 2% | |||||
| Bolle | 2% | 1% | |||||
| Other | 29% | 25% | 23% | 18% | 17% | 15% | 10% |
| None | 3% |
Oakley continues to dominate the eyewear category among Cape Epic participants. After a sharp decline from 2016 to 2017, Rudy Project appears to have stabilised, while adidas remains the choice of 10% of the field. This was the first year ‘None’ was given as an option and the 3% surprised us in a sport where eye damage is a certain risk.

Photo by Mark Sampson/Cape Epic/SPORTZPICS
Bicycle transport bag/box
| 2017 | 2018 | |
| Evoc | 35% | 30% |
| Thule | 7% | 8% |
| Scicon | 5% | 5% |
| Other | 9% | 5% |
| Cardboard box | 3% | 4% |
| Bkind | 1% | 2% |
| Bike Box Alan | 1% | 1% |
| Pro (Shimano) | 1% | |
| B&W | 1% | 1% |
This a difficult product category to measure because not all entrants use a bike transport bag/box. A total of 724 of the 1223 riders that took the survey answered this question. Although still the dominant brand, Evoc dropped by 5% this year. The only other brands that seem to have a real presence are Thule and Scicon.
Did you miss Part 1 of the 2018 TREAD Absa Cape Epic Rider Survey? Check it out here: https://www.treadmtb.co.za/2018-absa-cape-epic-all-the-rider-stats/


