In Part 2 of our four-part reveal of the 2023 South African Mountain Biking Survey, presented by Garmin, we focus on bikes. Mountain bikes primarily, obviously, but also now eBikes and Gravel Bikes. A total of 2467 took our 60-question survey in December 2023, giving a good idea of bike related patterns and preferences of the South African mountain bike market, including brands, cost, components, tyres and more.
Since this has tables, it’s best viewed on a laptop or desktop computer. On a mobile phone, turn to landscape for best viewing.
What brand of bicycle do you ride/race currently (if you have more than one, mark your primary bike brand)?
| 2024 | 2023 | 2022 | 2021 | 2020 | 2019 | |
|---|---|---|---|---|---|---|
| Specialized | 20.35% | 20.41% | 20.83% | 21.85% | 19.53% | 21.15% |
| SCOTT | 14.59% | 14.93% | 16.20% | 15.35% | 15.14% | 19.80% |
| TREK | 12.33% | 12.13% | 10.04% | 8.01% | 6.40% | 3.06% |
| Giant | 6.68% | 6.90% | 7.03% | 8.89% | 9.49% | 8.91% |
| Cannondale | 6.54% | 6.94% | 6.46% | 7.22% | 6.47% | 7.02% |
| Titan | 5.80% | 5.23% | 3.72% | 3.22% | 3.64% | 0.99% |
| Silverback | 4.36% | 3.93% | 5.00% | 5.35% | 8.32% | 5.94% |
| Merida | 4.14% | 3.85% | 5.68% | 5.87% | 6.60% | 6.57% |
| Santa Cruz | 3.47% | 4.02% | 3.11% | 3.41% | 3.15% | 2.97% |
| Pyga | 3.10% | 3.30% | 4.43% | 3.64% | 2.40% | 4.14% |
| Orbea | 2.84% | 1.80% | 0.84% | – | – | – |
| Momsen | 2.07% | 2.72% | 3.01% | 3.12% | 3.48% | 3.78% |
| Liv | 1.14% | 0.96% | 0.67% | 0.39% | – | – |
| Canyon | 0.85% | 0.33% | 0.67% | 0.39% | 0.49% | 0.54% |
| Norco | 0.81% | 1.38% | 1.42% | 1.21% | 1.17% | 1.17% |
| Yeti | 0.74% | 0.92% | 0.84% | 0.79% | 1.04% | 1.08% |
| KTM | 0.70% | 0.92% | 0.67% | 0.98% | 1.04% | 1.26% |
| GT | 0.70% | 0.59% | 0.78% | 1.08% | 1.59% | 1.53% |
| Rocky Mountain | 0.52% | 0.59% | 0.50% | 0.79% | 0.71% | 0.72% |
| Bianchi | 0.37% | 0.50% | 0.74% | 0.75% | 0.49% | 0.72% |
| BMC | 0.37% | 0.39% | – | – | – | – |
| Other | 7.53% | 7.65% | 6.83% | 6.21% | 7.03% | 6.04% |
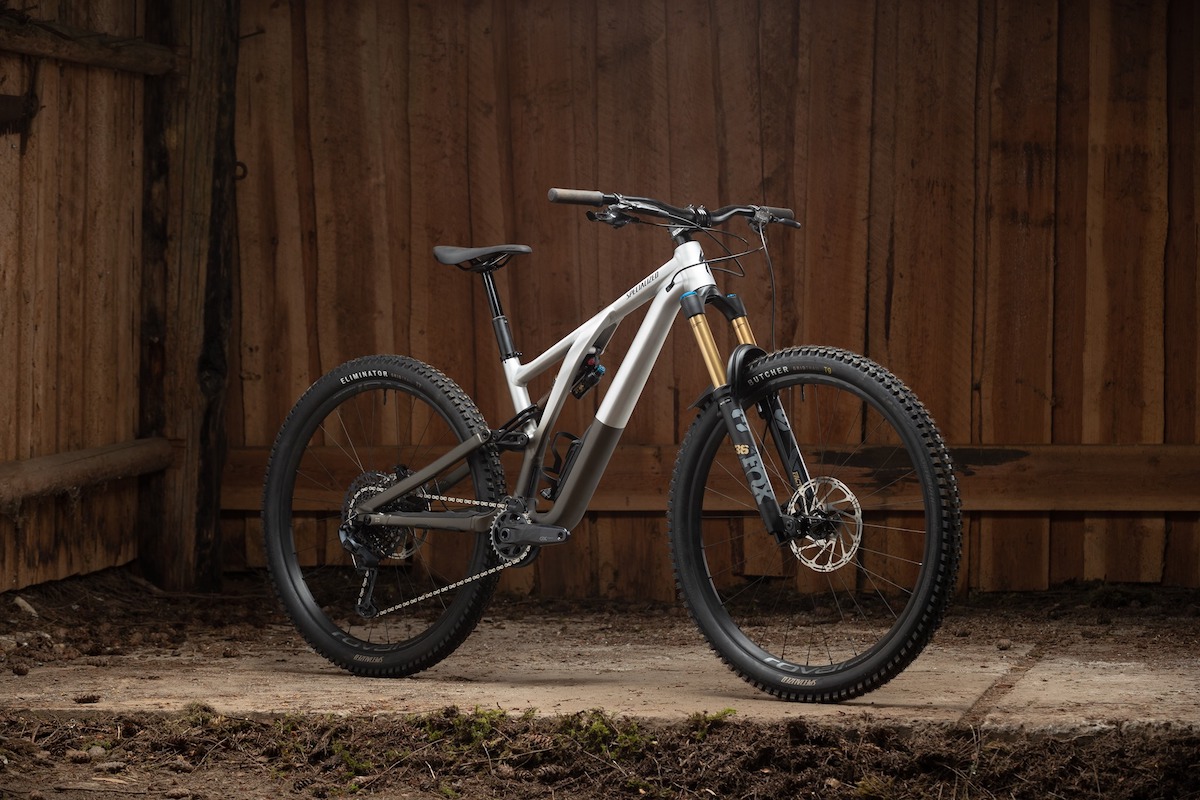
Notable climbers since the previous year are TREK and Titan, while Santa Cruz and Orbea also enjoyed some growth; and BMC appeared in our top 20 for the first time. Specialized and SCOTT remain at the top, but both dropped in market-share slightly. Trek’s progression from 2019 is impressive.
There were 93 bike brands mentioned!

What did your bike cost?
| Cost of bike | 2024 | 2023 | 2022 | 2021 | 2020 |
|---|---|---|---|---|---|
| Under R10 000 | 4.47% | 4.68% | 3.92% | 4.95% | 6.66% |
| R10 000-R14 999 | 5.72% | 5.02% | 5.85% | 6.50% | 9.36% |
| R15 000-R19 999 | 4.21% | 5.69% | 6.02% | 5.97% | 6.63% |
| R20 000-R24 999 | 4.65% | 4.06% | 4.74% | 5.58% | 6.43% |
| R25 000-R29 999 | 5.02% | 4.18% | 5.41% | 5.38% | 6.53% |
| R30 000-R34 999 | 4.91% | 4.89% | 5.11% | 6.10% | 6.92% |
| R35 000-R39 999 | 4.54% | 4.68% | 4.94% | 6.46% | 6.95% |
| R40 000-R44 999 | 4.43% | 4.98% | 5.58% | 6.17% | 6.08% |
| R45 000-R49 999 | 4.62% | 4.94% | 5.51% | 5.05% | 5.10% |
| R50 000-R54 999 | 4.32% | 4.06% | 4.70% | 4.43% | 4.35% |
| R55 000-R59 999 | 2.92% | 2.97% | 2.88% | 3.31% | 3.41% |
| R60 000-R64 999 | 3.29% | 3.14% | 3.32% | 3.77% | 3.31% |
| R65 000-R69 999 | 2.92% | 3.39% | 2.74% | 4.04% | 3.35% |
| R70 000-R74 999 | 2.95% | 3.76% | 3.48% | 2.82% | 3.09% |
| R75 000-R79 999 | 2.33% | 2.93% | 2.84% | 3.05% | 2.60% |
| R80 000-R84 999 | 3.73% | 4.39% | 4.53% | 3.38% | 2.66% |
| R85 000-R89 999 | 2.58% | 2.63% | 2.88% | 2.85% | 2.08% |
| R90 000-R94 999 | 2.40% | 2.97% | 2.40% | 2.33% | 2.05% |
| R95 000-R99 999 | 2.33% | 2.55% | 2.06% | 2.20% | 1.40% |
| R100 000-R109 999 | 5.24% | 4.39% | 4.50% | 3.74% | 3.28% |
| R110 000-R119 999 | 3.06% | 3.68% | 3.21% | 2.99% | 1.82% |
| R120 000-R129 999 | 3.69% | 3.47% | 2.84% | 2.26% | 1.59% |
| R130 000-R139 999 | 2.66% | 1.59% | 1.59% | 1.64% | 0.94% |
| R140 000-R149 999 | 2.55% | 2.13% | 2.00% | 1.21% | 0.88% |
| R150 000 or more | 10.45% | 8.82% | 6.94% | 3.81% | 2.50% |
The average bike price based on this survey for 2023 is R55 763. this is down from R65 450 of the previous year and slightly up on 2021. Consider the fact that a surplus of product in 2023 led to the widespread discounting of new bikes, not only in South Africa, but globally, which is likely the reason the average price dropped by almost R10 000. Also, an increasing number of mid-range bikes are more available – bikes that ride great, but which aren’t as light as a top-end model.
Average bike price
| 2024 | 2023 | 2022 | 2021 | 2020 |
|---|---|---|---|---|
| R72 439 | R55 763 | R65 450 | R55 000 | R48 971 |
Which accurately describes your bike best?
| 2024 | 2023 | 2022 | 2021 | 2020 | |
|---|---|---|---|---|---|
| It’s a hardtail | 18.35% | 19.36% | 19.59% | 21.42% | 24.34% |
| It’s a full-suspension | 70.31% | 68.93% | 69.42% | 66.47% | 63.80% |
| I own both hardtail and full-suspension bikes | 11.34% | 11.71% | 10.99% | 12.11% | 11.86% |
Not much change here, with full-suspension still dominant.

What wheel size is your mountain bike?
| 2024 | 2023 | 2022 | 2021 | 2020 | |
|---|---|---|---|---|---|
| 29-inch | 90.44% | 90.38% | 90.22% | 89.50% | 86.81% |
| 27.5-inch (650b) | 3.66% | 3.72% | 4.87% | 5.41% | 7.15% |
| 27.5-inch Plus | 1.48% | 1.63% | 0.78% | 1.15% | 1.33% |
| 26-inch | 2.73% | 2.97% | 3.32% | 3.94% | 4.71% |
| Mullet | 1.70% | 1.30% | 0.81% | – | – |
Confirmation that South Africa is still the 29-inch wheel capital of the world…
What material is your mountain bike’s frame made from?
| Frame material | 2024 | 2023 | 2022 | 2021 | 2020 |
|---|---|---|---|---|---|
| Carbon fibre | 57.68% | 59.05% | 55.75% | 52.95% | 47.74% |
| Aluminium | 32.57% | 31.79% | 34.27% | 35.76% | 39.75% |
| Carbon/Alloy combo | 7.27% | 7.07% | 7.65% | 8.63% | 9.52% |
| Other (steel, titanium etc) | 2.47% | 2.09% | 2.33% | 2.66% | 2.99% |
An obsession with endurance racing and light-weight bikes sees yet another increase in the percentage of carbon fibre frames among South African mountain bikes.
How many chainrings does your mountain bike have?
| Number of chainrings | 2024 | 2023 | 2022 | 2021 | 2020 |
|---|---|---|---|---|---|
| 1 chainring | 88.12% | 81.81% | 82.31% | 74.87% | 67.99% |
| 2 chainrings | 9.01% | 12.05% | 10.89% | 15.41% | 19.24% |
| 3 chainrings | 4.87% | 6.15% | 6.80% | 9.71% | 12.77% |
The simplification of drivetrains continues with more and more entry-level bikes now also coming specced with a 1×10, 1×11 or 1×12 set-up. More Gravel bike owners took our survey last year, which probably explains the increase in 2x…

Which component brand does your mountain bike mostly have on it?
| Component brand | 2024 | 2023 | 2022 | 2021 | 2020 |
|---|---|---|---|---|---|
| SRAM | 45.09% | 42.95% | 43.34% | 39.11% | 36.04% |
| Shimano | 37.19% | 39.82% | 38.02% | 42.06% | 45.40% |
| Shimano/SRAM mix | 15.44% | 15.81% | 17.59% | 17.88% | 17.52% |
| Other | 2.29% | 1.42% | 1.05% | 0.95% | 1.04% |
After watching SRAM take over as the dominant component brand in 2022, Shimano held its own last year, clawing back slightly.
Which type of pedal do you ride with?
| Pedal type | 2023 | 2022 | 2021 | 2020 |
|---|---|---|---|---|
| Cleat pedal (clip-in) | 81.97% | 82.24% | 84.48% | 82.52% |
| Flat pedal | 12.25% | 11.64% | 8.66% | 10.59% |
| I use both | 5.77% | 6.12% | 6.86% | 6.89% |
A small increase for flat pedals over the previous year. This is likely reflective of the growing gravity/recreational riding market.
What brand of tyre do you prefer?
| Tyre brand | 2024 | 2023 | 2022 | 2021 | 2020 |
|---|---|---|---|---|---|
| Maxxis | 57.39% | 58.72% | 59.74% | 57.32% | 57.72% |
| Specialized | 12.11% | 12.84% | 13.02% | 12.93% | 12.38% |
| Vittoria | 8.71% | 8.24% | 8.66% | 9.81% | 9.94% |
| Schwalbe | 6.72% | 6.82% | 6.39% | 6.30% | 4.87% |
| Bontrager | 3.99% | 3.85% | 3.59% | 2.82% | 3.22% |
| Continental | 2.62% | 2.93% | 3.04% | 4.07% | 4.94% |
| Tufo | 1.40% | 0.70% | – | – | – |
| Pirelli | 1.37% | 1.21% | 1.05% | 0.69% | 0.29% |
| Kenda | 1.22% | 1.17% | 0.68% | 1.21% | 0.97% |
| Goodyear | 1.11% | 0.67% | 0.27% | – | – |
| Other | 2.76% | 1.31% | 0.95% | 1.86% | 0.78% |
| WTB | 0.25% | 0.41% | 0.39% | 0.75% | |
| Hutchinson | 0.21% | 0.27% | – | – | |
| Onza | 0.17% | 0.44% | 0.79% | 1.07% | |
| CST | 0.13% | 0.17% | 0.33% | 0.45% | |
| Mitas | 0.13% | 0.7% | 0.26% | 0.26% | |
| Michelin | 0.08% | 0.30% | 0.33% | 0.45% | |
| Vredestein | 0.08% | 0.27% | 0.23% | 0.42% | |
| Panaracer | 0.08% | 0.10% | – | – | |
| Other | 1.31% | 0.95% | 1.86% | 0.78% |
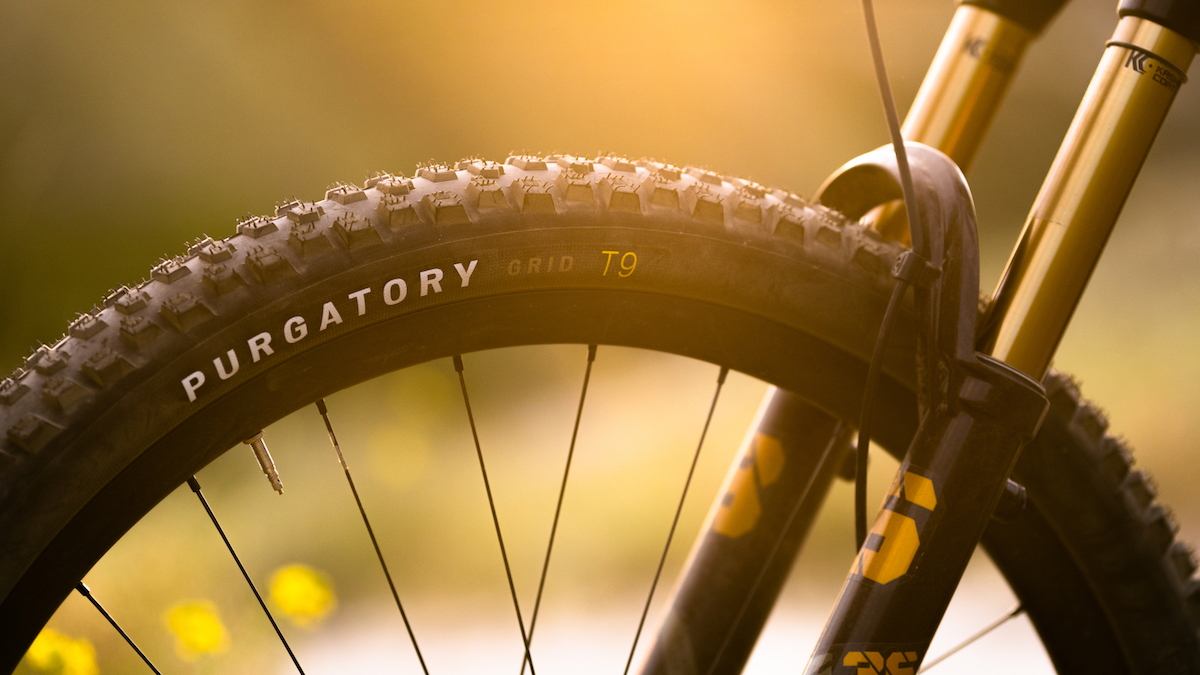
Not much change in the past year. Maxxis retains its very dominant position at the top, although it did drop a percentage. Tufo made an appearance in 2023, and Schwalbe, Bontrager, Pirelli, Kenda and Good Year all experienced incremental increases.

Does your mountain bike have a dropper seatpost?
| 2024 | 2023 | 2022 | |
|---|---|---|---|
| Yes and I use it all the time | 46.31% | 42.79% | 41.37% |
| No | 42.58% | 46.76% | 50.51% |
| Yes, but I don’t really use it | 11.12% | 10.46% | 8.12% |
Like 29-inch wheels around a decade ago, we expect this to change each year in favour of dropper seatposts. Frustrating to see such a high percentage that have a dropper, but don’t really use it. It’s like living with a super power that you don’t use…
Do you own an eBike?
| 2024 | 2023 | 2022 | |
|---|---|---|---|
| Yes | 13.37% | 12.67% | 9.94% |
| No | 83.75% | 83.40% | 86.36% |
| I plan to buy one soon | 2.36% | 3.14% | 3.21% |
| Other | 0.52% | 0.79% | 0.47% |
A little bit of growth here which is not that surprising. eBikes are enabling and are being increasingly embraced.
If you own an eBike, what brand do you have?
| Bike brand | 2024 | 2023 | 2022 |
|---|---|---|---|
| Specialized | 26.41% | 28.74% | 44.89% |
| TREK | 15.12% | 15.13% | 12.58% |
| SCOTT | 10.75% | 11.49% | 10,20% |
| Giant/Liv | 9.29% | 8.24% | 11.22% |
| Orbea | 4.37% | 1.34% | 2.72% |
| Cannondale | 2.73% | 2.11% | 1.70% |
| Santa Cruz | 2.55% | 3.45% | 1.70% |
| Pyga | 1.64% | 1.15% | 2.72% |
| Silverback | 0.91% | 0.57% | 1.70% |
| Titan | 0.73% | 1.15% | 0.68% |
| Merida | 0.73% | 0.77% | 3.06% |
| KTM | 0.73% | 0.57% | 1.02% |
| Outer | 0.73% | – | – |
| Vincent | 0.55% | 0.96% | 0.68% |
| Bianchi | 0.55% | 0.77% | 0.68% |
| Other | 22.22% | 23.18% | 1.02% |
| Other | 23.18% | 1.02% |
We’re unsure why, but 522 responded to this question, even though over 200 of them don’t actually own an eBike. So they put ‘N/A or ‘Don’t own one’ under OTHER, which skewed the percentage compared to 2022. Of the 303 that gave the model of the eBike they own, this is the breakdown. Specialized is still a strong leader here with TREK, SCOTT, Santa Cruz and Cannondale all showing increases over the previous year.

Do you own a gravel bike?
| 2024 | 2023 | 2022 | |
|---|---|---|---|
| Yes | 18.72% | 16.90% | 12.18% |
| No | 74.85% | 76.54% | 81.94% |
| I plan to buy one soon | 6.43% | 6.57% | 5.89% |
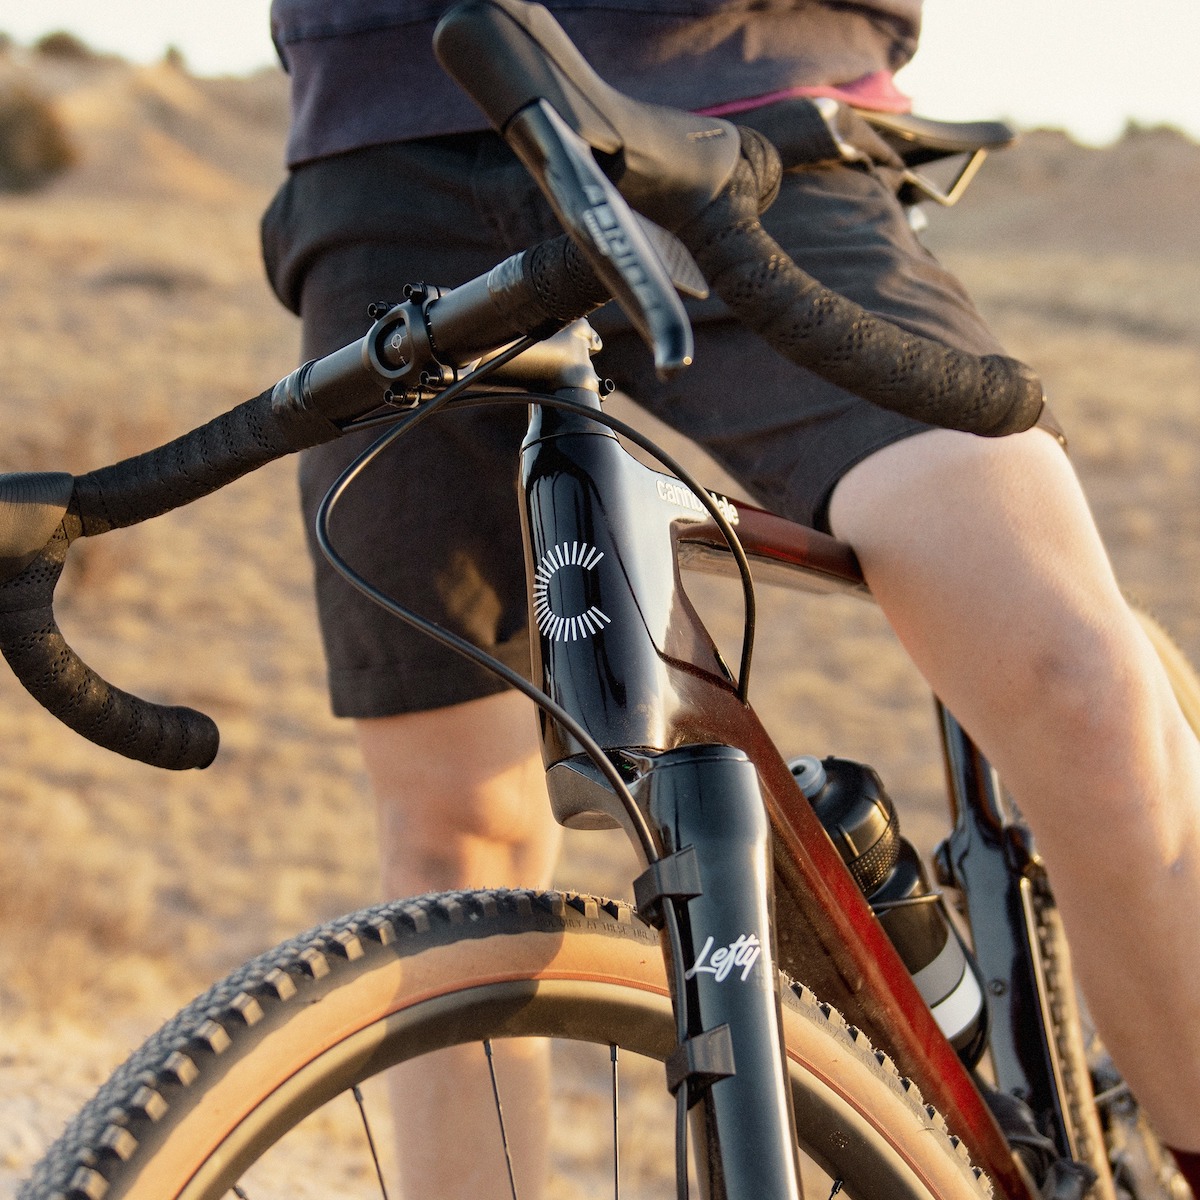
We’re not surprised to see this increase in one year. Unfortunately, road racing in South Africa is going through a tough time for various reasons and that’s led to an increase in Gravel bike sales and event participation. There’s also a large chunk of South African mountain bikers that aren’t into technical riding, so spend hours and hours pedalling a mountain bike on gravel roads. For many of those, a Gravel bike offers greater efficiency.
What Gravel bike brand do you own?
| Bike brand | 2024 | 2023 | 2022 |
|---|---|---|---|
| Specialized | 22.00% | 19.91% | 20.05% |
| TREK | 14.93% | 13.78% | 6.95% |
| Giant/Liv | 9.04% | 8.53% | 9.62% |
| Titan Racing | 7.86% | 4.81% | 2.94% |
| SCOTT | 6.09% | 7.00% | 3.74% |
| Cannondale | 5.50% | 7.87% | 7.21% |
| Silverback | 3.54% | 3.24% | 2.94% |
| Bianchi | 3.54% | 3.06% | 2.67% |
| Curve | 2.55% | 1.75% | 4.27% |
| Merida | 2.55% | 2.18% | – |
| Norco | 2.55% | 2.84% | 1.87% |
| Santa Cruz | 2.36% | 2.62% | 1.60% |
| Orbea | 2.36% | 1.53% | – |
| Momsen | 2.16% | 3.06% | 3.20% |
| Canyon | 2.16% | 1.53% | 4.01% |
| Rondo | 1.96% | 0.65% | 3.47% |
| BMC | 1.38% | 0.87% | – |
| Pinarello | 1.38% | 0.87% | – |
| Rook | 1.18% | 1.53% | 2.40% |
| Basso | 0.98% | 1.09% | 1.33% |
| Niner | 0.79% | 0.65% | 1.06% |
| Ridley | 0.79% | 0.65 | 1.06% |
| Sling | 0.59% | 0.87% | 1.33% |
| Raleigh | 0.39% | 1.09% | – |
| Avalanche | 0.39% | 0.65% | – |
| Open | 0.39% | 0.65% | – |
| Ritchey | 0.39% | 0.65% | 1.06% |
| Lynskey | 0.20% | 0.65% | 1.33% |
| Other | 31.04% | 2.77% | 14.56% |
A total of 457 named their gravel bike band. In 2022, there were limited gravel bike models available, but in 2023 that problem was solved. TREK, SCOTT and Titan experienced big increases in market share relative to their 2022 positions, while several other brands also showed increases and a few new brands showed some prominence.

Did you miss Part 1 of our 2023 South African Mountain Biking Survey, presented by Garmin? Here’s the link.
Look out for Parts 3 (Performance) and 4 (Gear) coming soon.


