Well that was different! A Cape Epic in October with a field less than half the normal size. From a spectator’s perspective it looked beautiful. And tough. And hot. And wet! And it gave us a feeling of familiarity that gives us hope and optimism. What was the 17th edition of the Absa Cape Epic like from a rider’s perspective? Well, for starters, it was really tough. That’s the word from riders that have done a few and the stats confirm this…
By Sean Badenhorst | Images: Cape Epic
There wasn’t one stage that was longer than 100km, but the 2021 Cape Epic was still incredibly demanding. Why is that? Well, there are three obvious reasons – the terrain, the type of trails and the weather. After the prologue on the slopes of Table Mountain, the Cape Epic moved to Ceres, which is known for its rough-surface terrain.
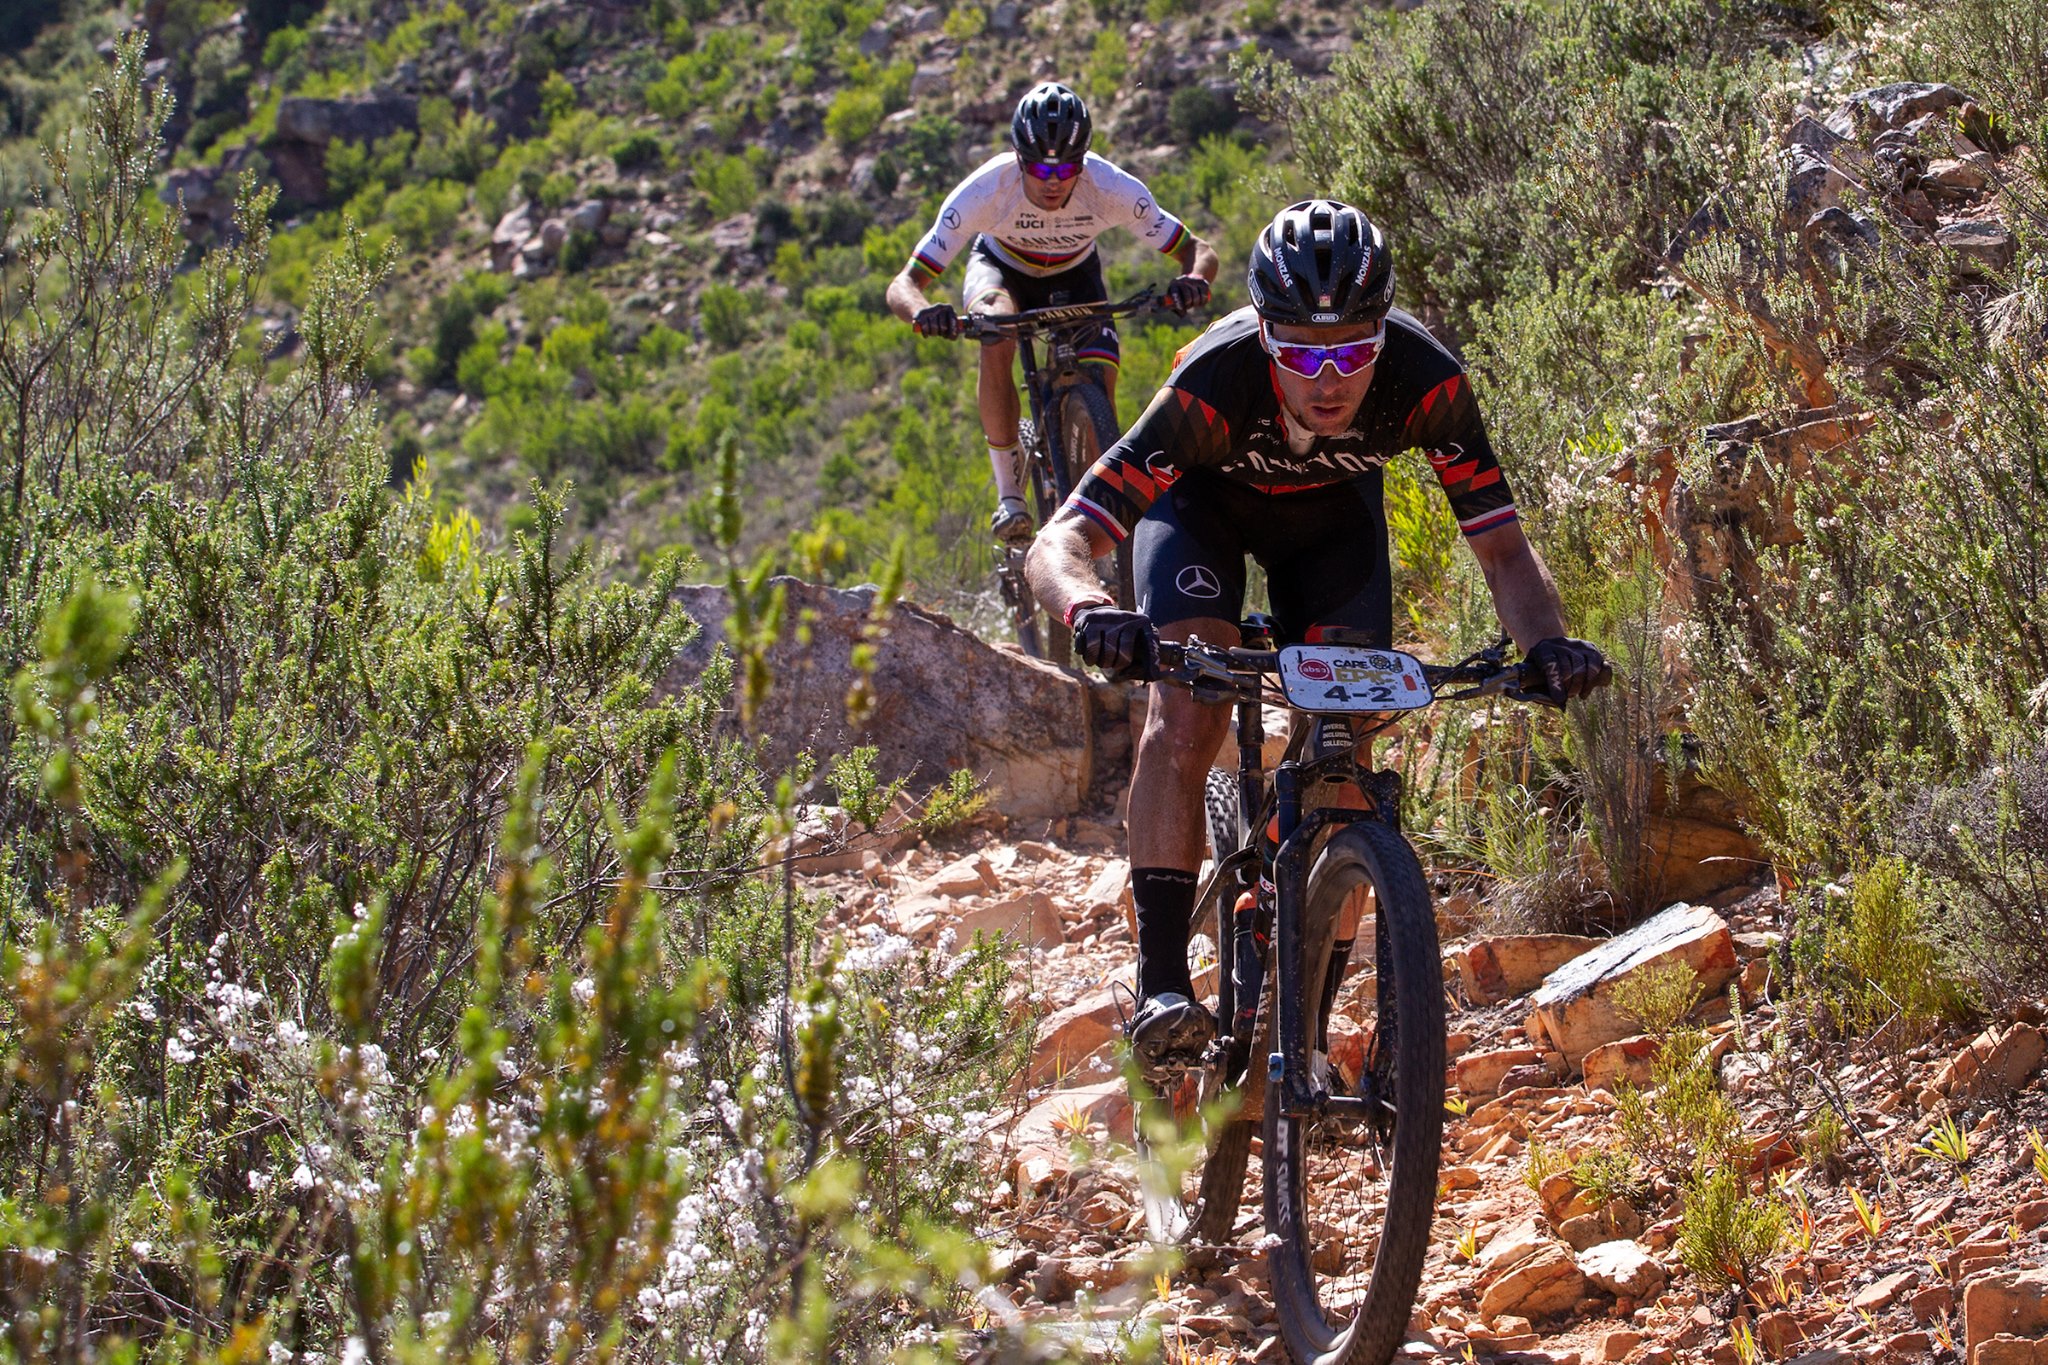
Stage 1 is normally more than 100km in distance and is usually a real wake-up call for those that skipped more than a few planned training sessions. At 98km with 1800m of climbing, Stage 1 this year was under 100km for the first time since 2013. But it incorporated the trails on the Eselfontein Farm, which aren’t smooth.
Add on another two successive 90km-plus stages with over 2000m of climbing around Tulbagh and the Witzenberg Valley, also known for its relentless and unpredictable surfaces and you have three full days of toil. When the terrain is loose or rough, finding a rhythm is a constant battle. Rhythm is both physical and mental and having some rhythm makes mountain biking a little bit easier. Not much, but a little bit. Add hundreds of moments of rhythm together on a Cape Epic stage and you save a little energy. Have no real rhythm for three stages in succession and you use a lot of energy because you can’t really relax on the climbs or the descents.
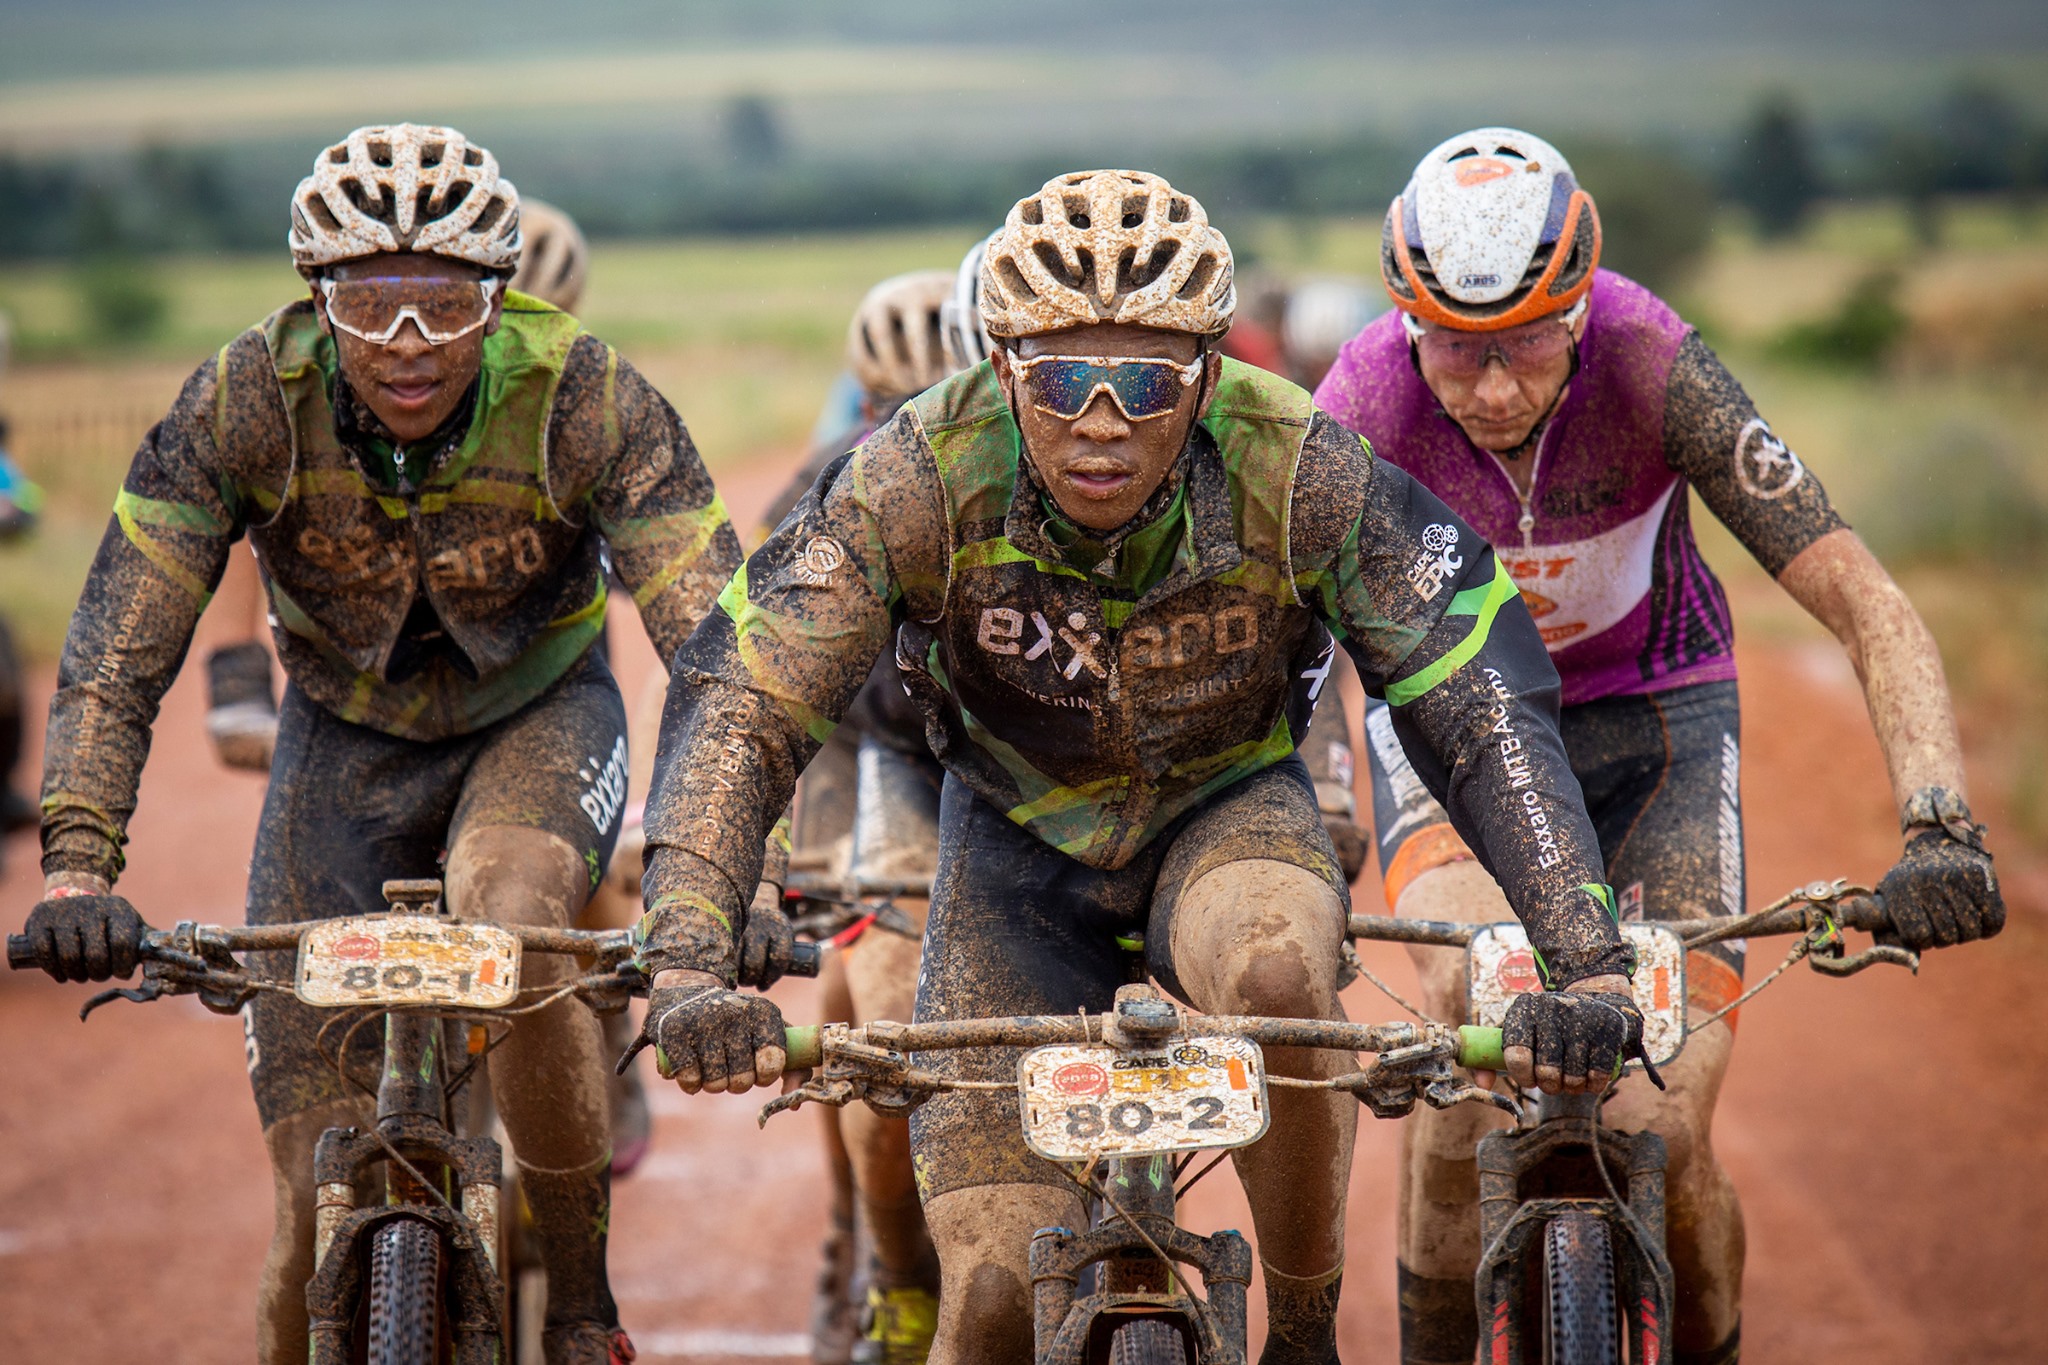
The ‘transition stage’ on Day 5, (Stage 4) was meant to be shorter and easier. But a constant wind combined with some steep, rough climbs and more concentration-sapping stony singletrack descending delivered an unexpectedly arduous day. Chuck in heat at over 35 deg C and a bus transfer of one hour straight after the stage to the race village and you have a whole lot of weary, irritable mountain bikers.
Lots of singletrack and climbing with some rain on Day 6 followed by more singletrack and climbing on Day 7 with a very muddy route and you have everything thrown at the competitors from a natural perspective. Add in daily Covid-19 protocols for good measure – maybe not a big thing, but an extra thing…
The other prevalent feature of those first three full stages was the high volume of singletrack. There are more established mountain bike trails in the Western Cape than the rest of South Africa combined. And a large chunk of those are in the winelands region. Normally, Wellington’s trails would be considered singletrack heaven. But when you’re creased after four successive demanding Cape Epic stages it’s more like mountain biking hell. Not for everyone, but for those who aren’t accustomed to riding singletrack under race pressure in a state of fatigue. That 68km final stage to Val de Vie wasn’t easy, but was a mercifully shorter conclusion.
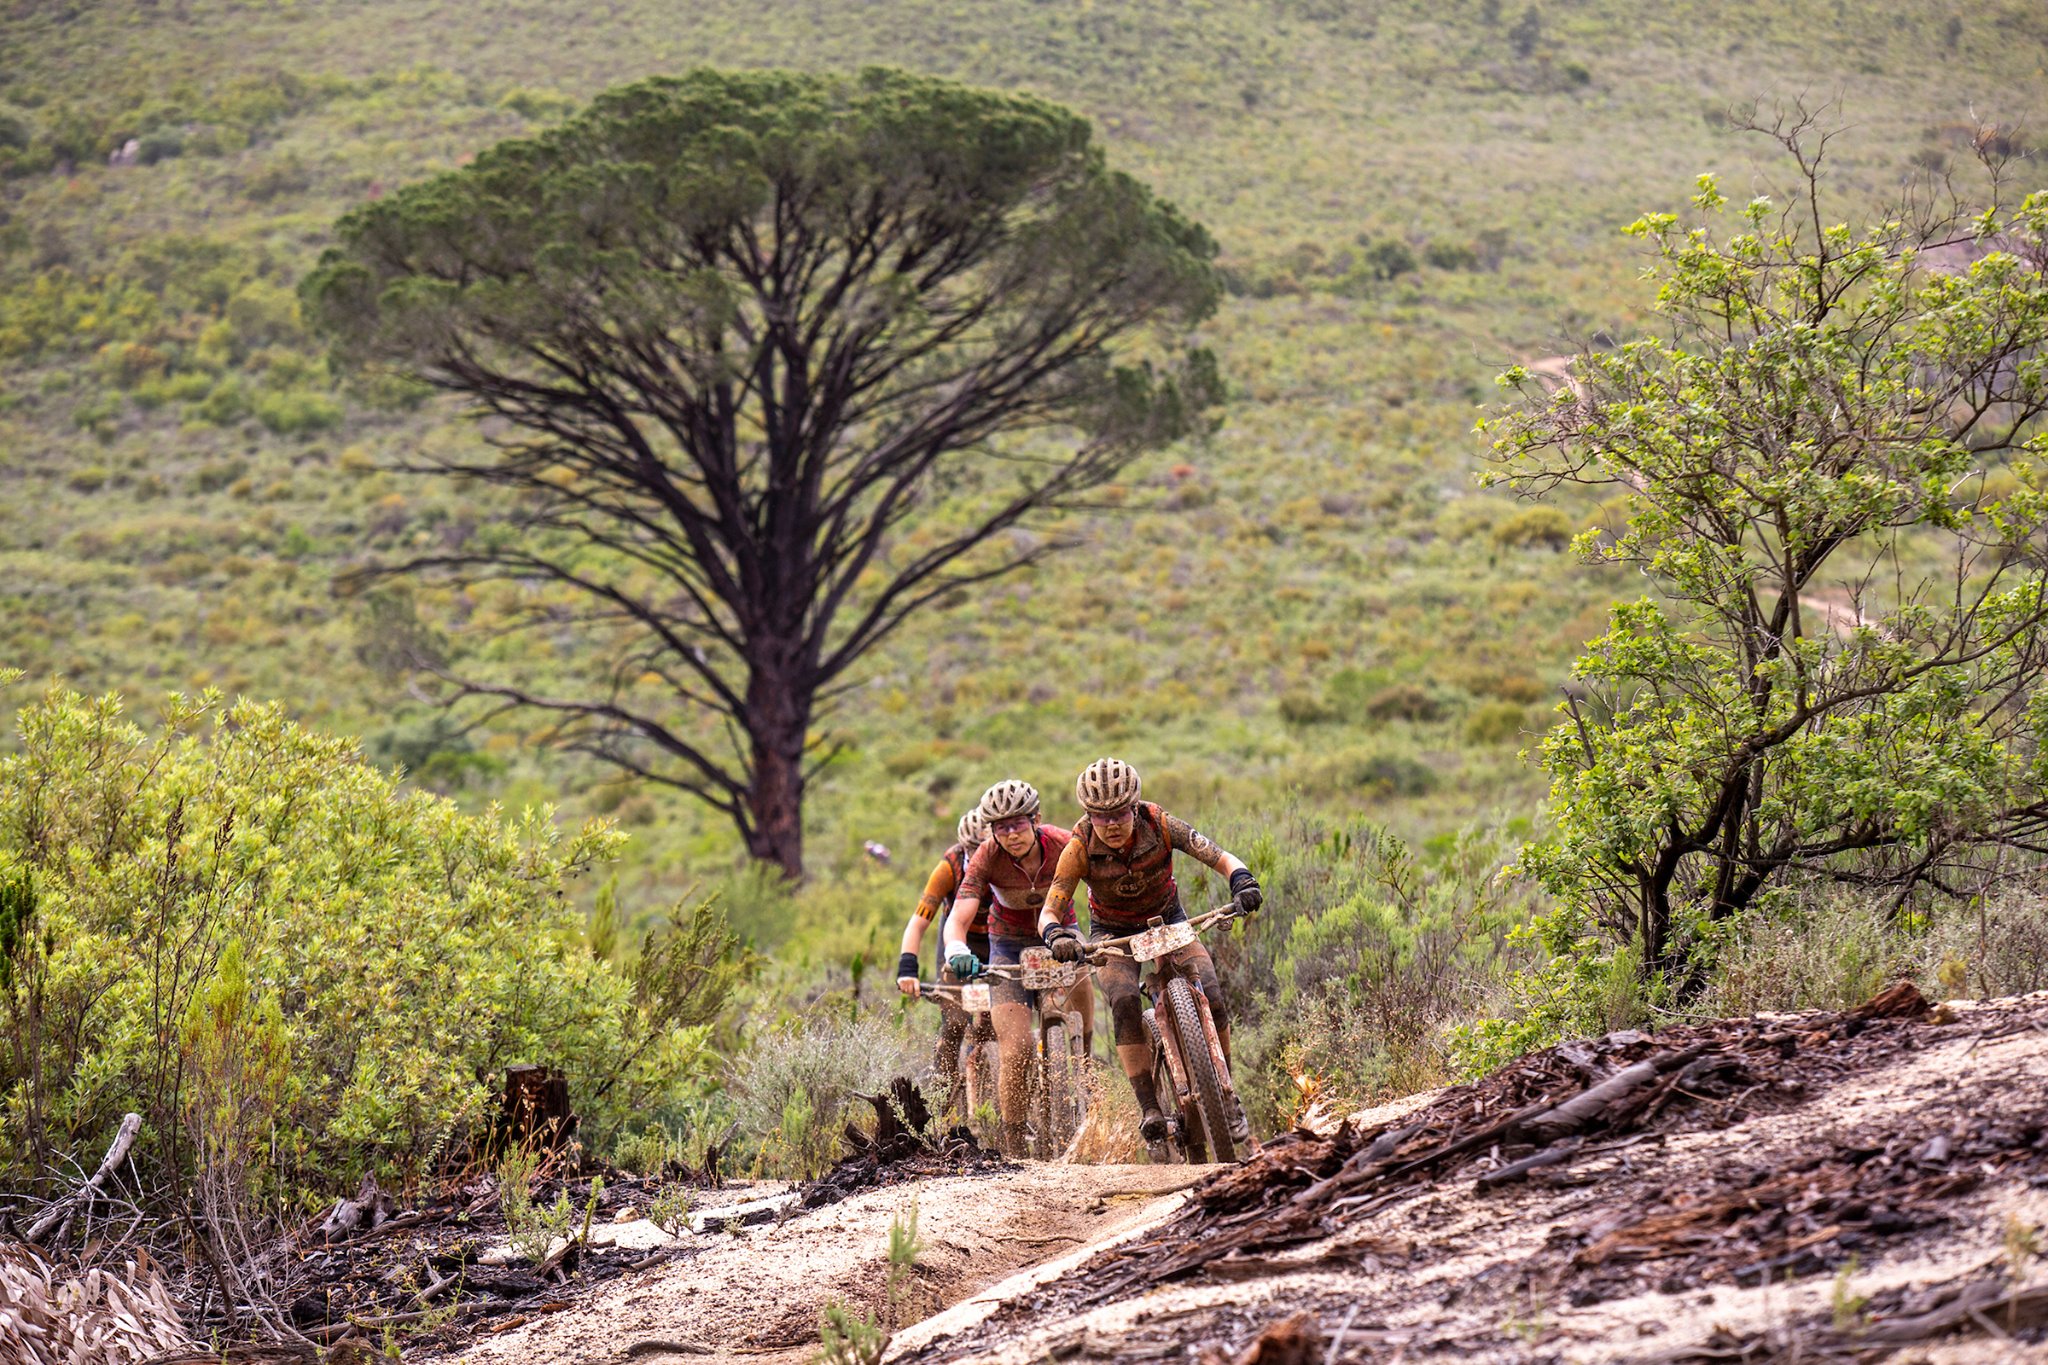
“Four five-hour days in a row! That was a first for me at an Epic,” said Oli Munnik who completed his 11th Cape Epic. And he’s no slouch. He’s normally a top-80 finisher and this year he and his teammate, Mark Pienaar, finished 45th overall.
“That first half was tough. Loads of singletrack. Then there was loads of singeltrack in the second half too. Saps your energy because there’s no place to hide. Glad I wasn’t on a hardtail this one!” added Munnik.
“Stage 4 was sold to us as a transfer stage – shortened due to road works. I expected it to be a relatively easy one. It was anything but! It was probably the least enjoyable day I have ever had on a bike! I felt okay, but from the first pedal stroke I found the terrain and the landscape thoroughly unpleasant,” said Mark Nel, a two-decade bicycle racer, who was doing his third Epic, but as a last-minute call-up, so on no specific training.
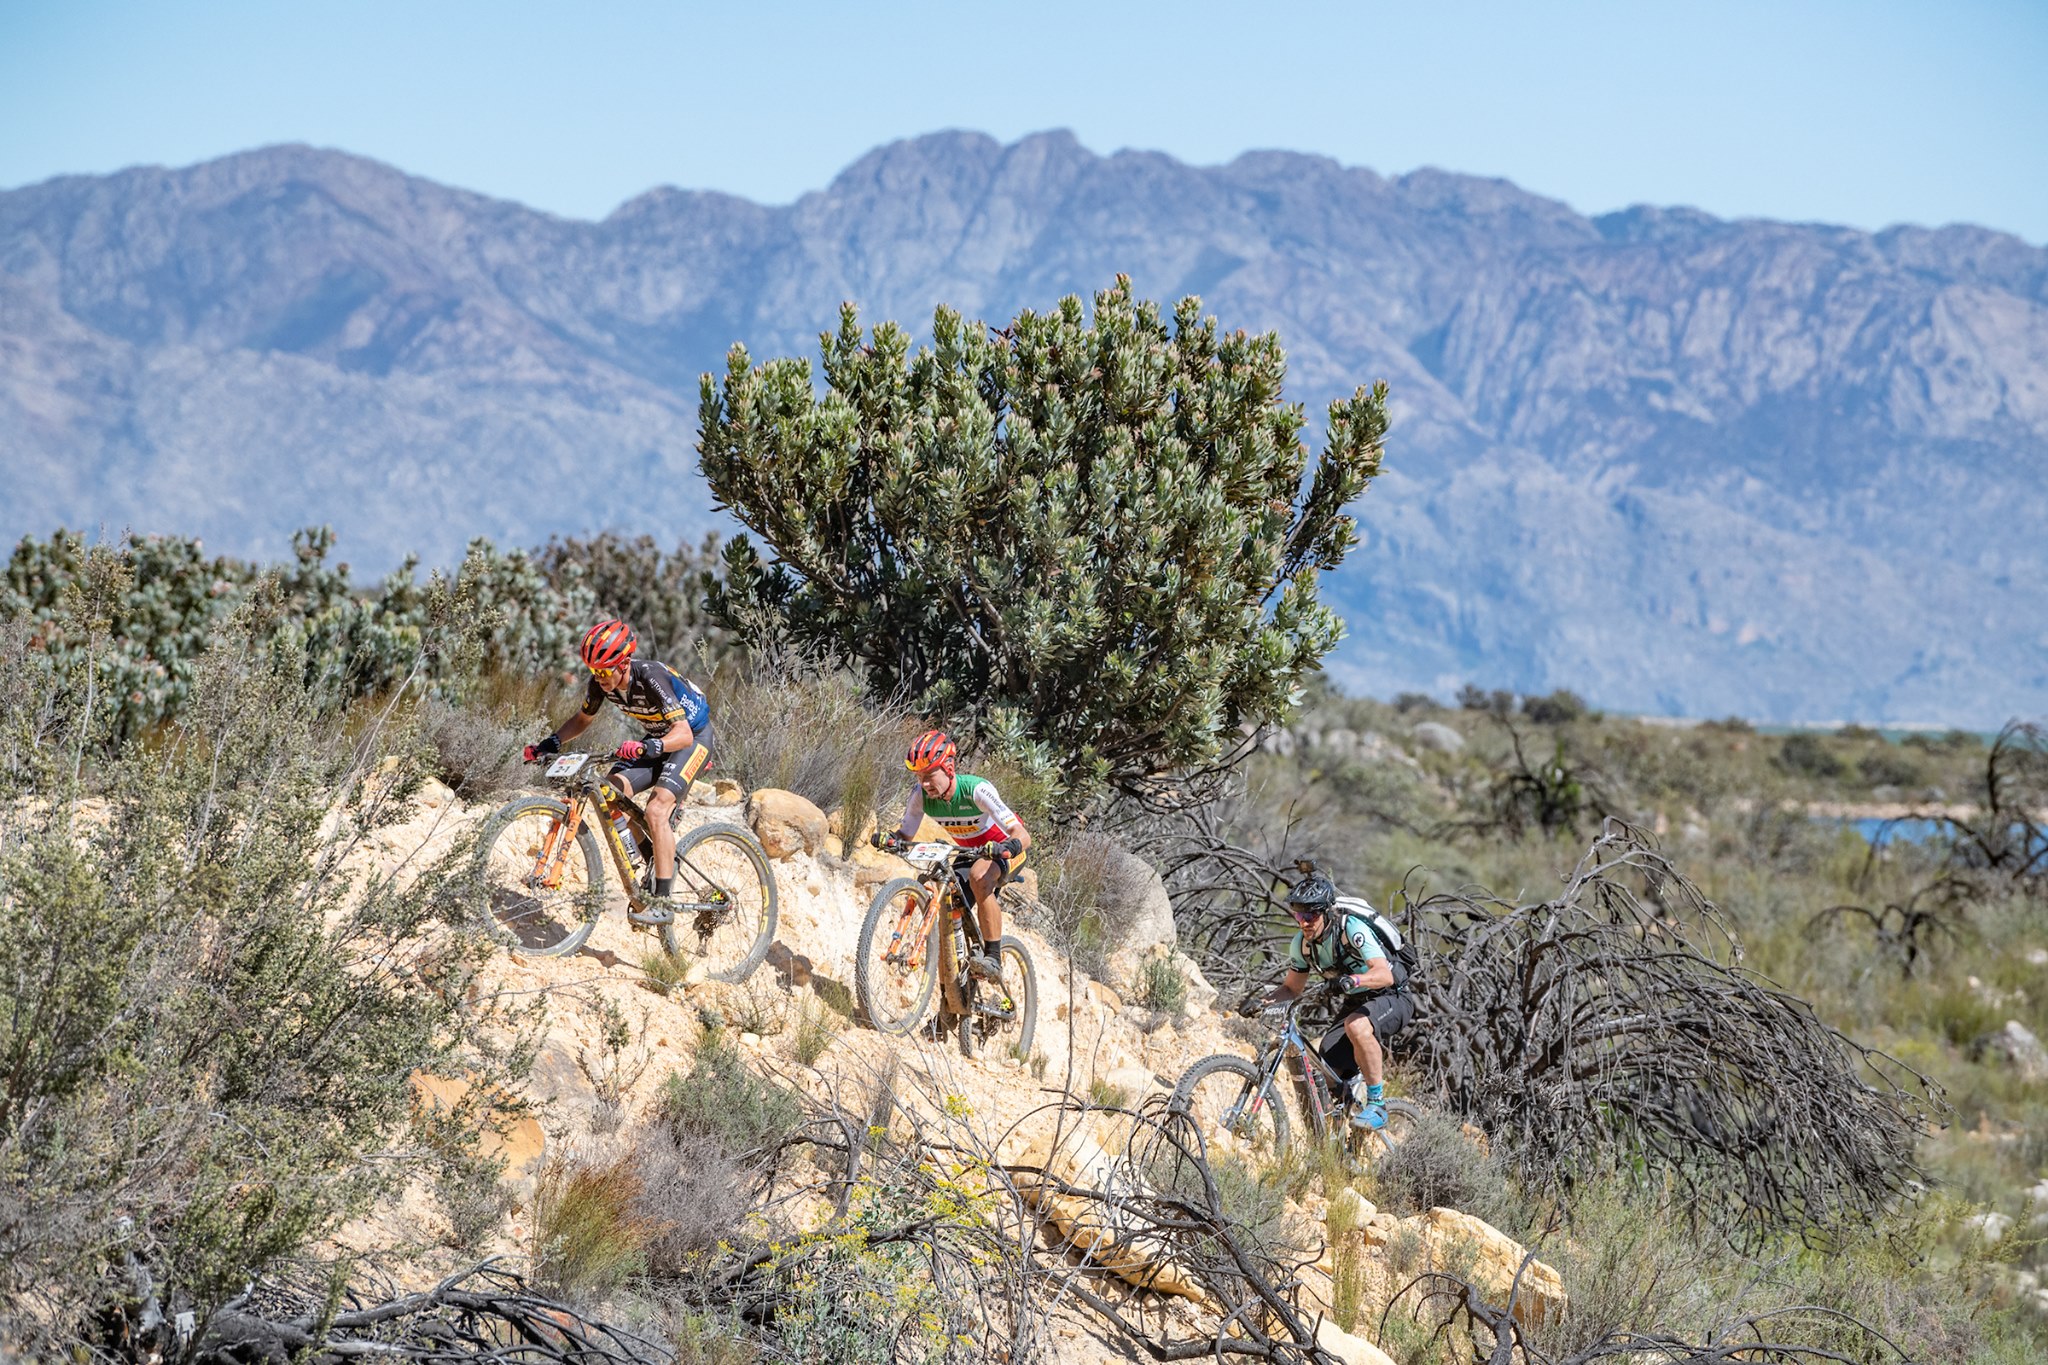
“The route had a great mix of terrain. There was a lot of singletrack and jeep track. And the jeep track was a lot more technical than much of the singletrack. I love riding this type of varied terrain where where you need full concentration due to it being unpredictable,” said Craig Uria who was doing his seventh Cape Epic and who won the Masters category with Andrew Duvenage.
“The climbing was proper too. There seems to be a higher focus on more climbing per kilometre rather than distance, with a mix of different types of climbs. This was certainly one of the most challenging routes I have done. It seems like the first three days really hammered the riders as there were certainly weren’t many – if any – free miles,” added Uria

“The Epic in October is next level! The dams were full, the farm fields were flourishing and the traction was amazing. With just five months until March, it was an awesome Epic 2022 training camp! They should let the pros do their Epic in March and everyone else ride it in October,” grinned Munnik.
“The technical trails were dominant with little chance for recovery. You really had to push hard on the climbs to keep a decent pace. Then the weather was just crazy. I loved every bit of the route though. If it was mostly open gravel roads I wouldn’t have been impressed. It was a fantastic experience and I’m already planning on doing another one!” said Cape Epic novice, Engela Conradie, who, along with teammate Greg Hill, stayed in the race tents.
Because the 2020 edition was cancelled and the postponed 2021 edition was mostly 2020 entrants, there was no need to do another rider survey. But we were able to update some of the rider stats after the event as we normally do, showing drop-out percentage, finisher numbers and most successful riders.

Start and finish stats of complete teams
Tables are best viewed on a laptop/desktop, or turn your mobile device to landscape.
| Year | All Start | All Finish | % teams DNF |
| 2021 | 290 | 247 | 14.8% |
| 2020 | – | – | – |
| 2019 | 690 | 597 | 13.5% |
| 2018 | 672 | 564 | 16.1% |
| 2017 | 666 | 503 | 24.4% |
| 2016 | 648 | 483 | 25.5% |
| 2015 | 624 | 512 | 18% |
| 2014 | 620 | 522 | 15.7% |
| 2013 | 630 | 496 | 21.4% |
| 2012 | 605 | 481 | 20.5% |
| 2011 | 604 | 496 | 18% |
| 2010 | 589 | 445 | 24.5% |
| 2009 | 598 | 503 | 16.1% |
| 2008 | 599 | 435 | 27.4% |
| 2007 | 624 | 468 | 25% |
| 2006 | 466 | 379 | 19.1% |
| Ave | 595 | 475 | 17.6% |
| Pre-Covid-19 Ave | 617 | 492 | 20.4% |
With 690 teams, the 2019 was the Cape Epic edition with the most starters. And the most finishers at 597 teams. Due to Covid-19 regulations, the 2021 edition had the smallest field in the race’s history (290 teams). Although it was considered a tough edition, the non-finish rate was still quite low at 14.8% and well below the average of 17.6%.
Note: these stats exclude the first two editions (2004 and 2005) as we have no data on those events.
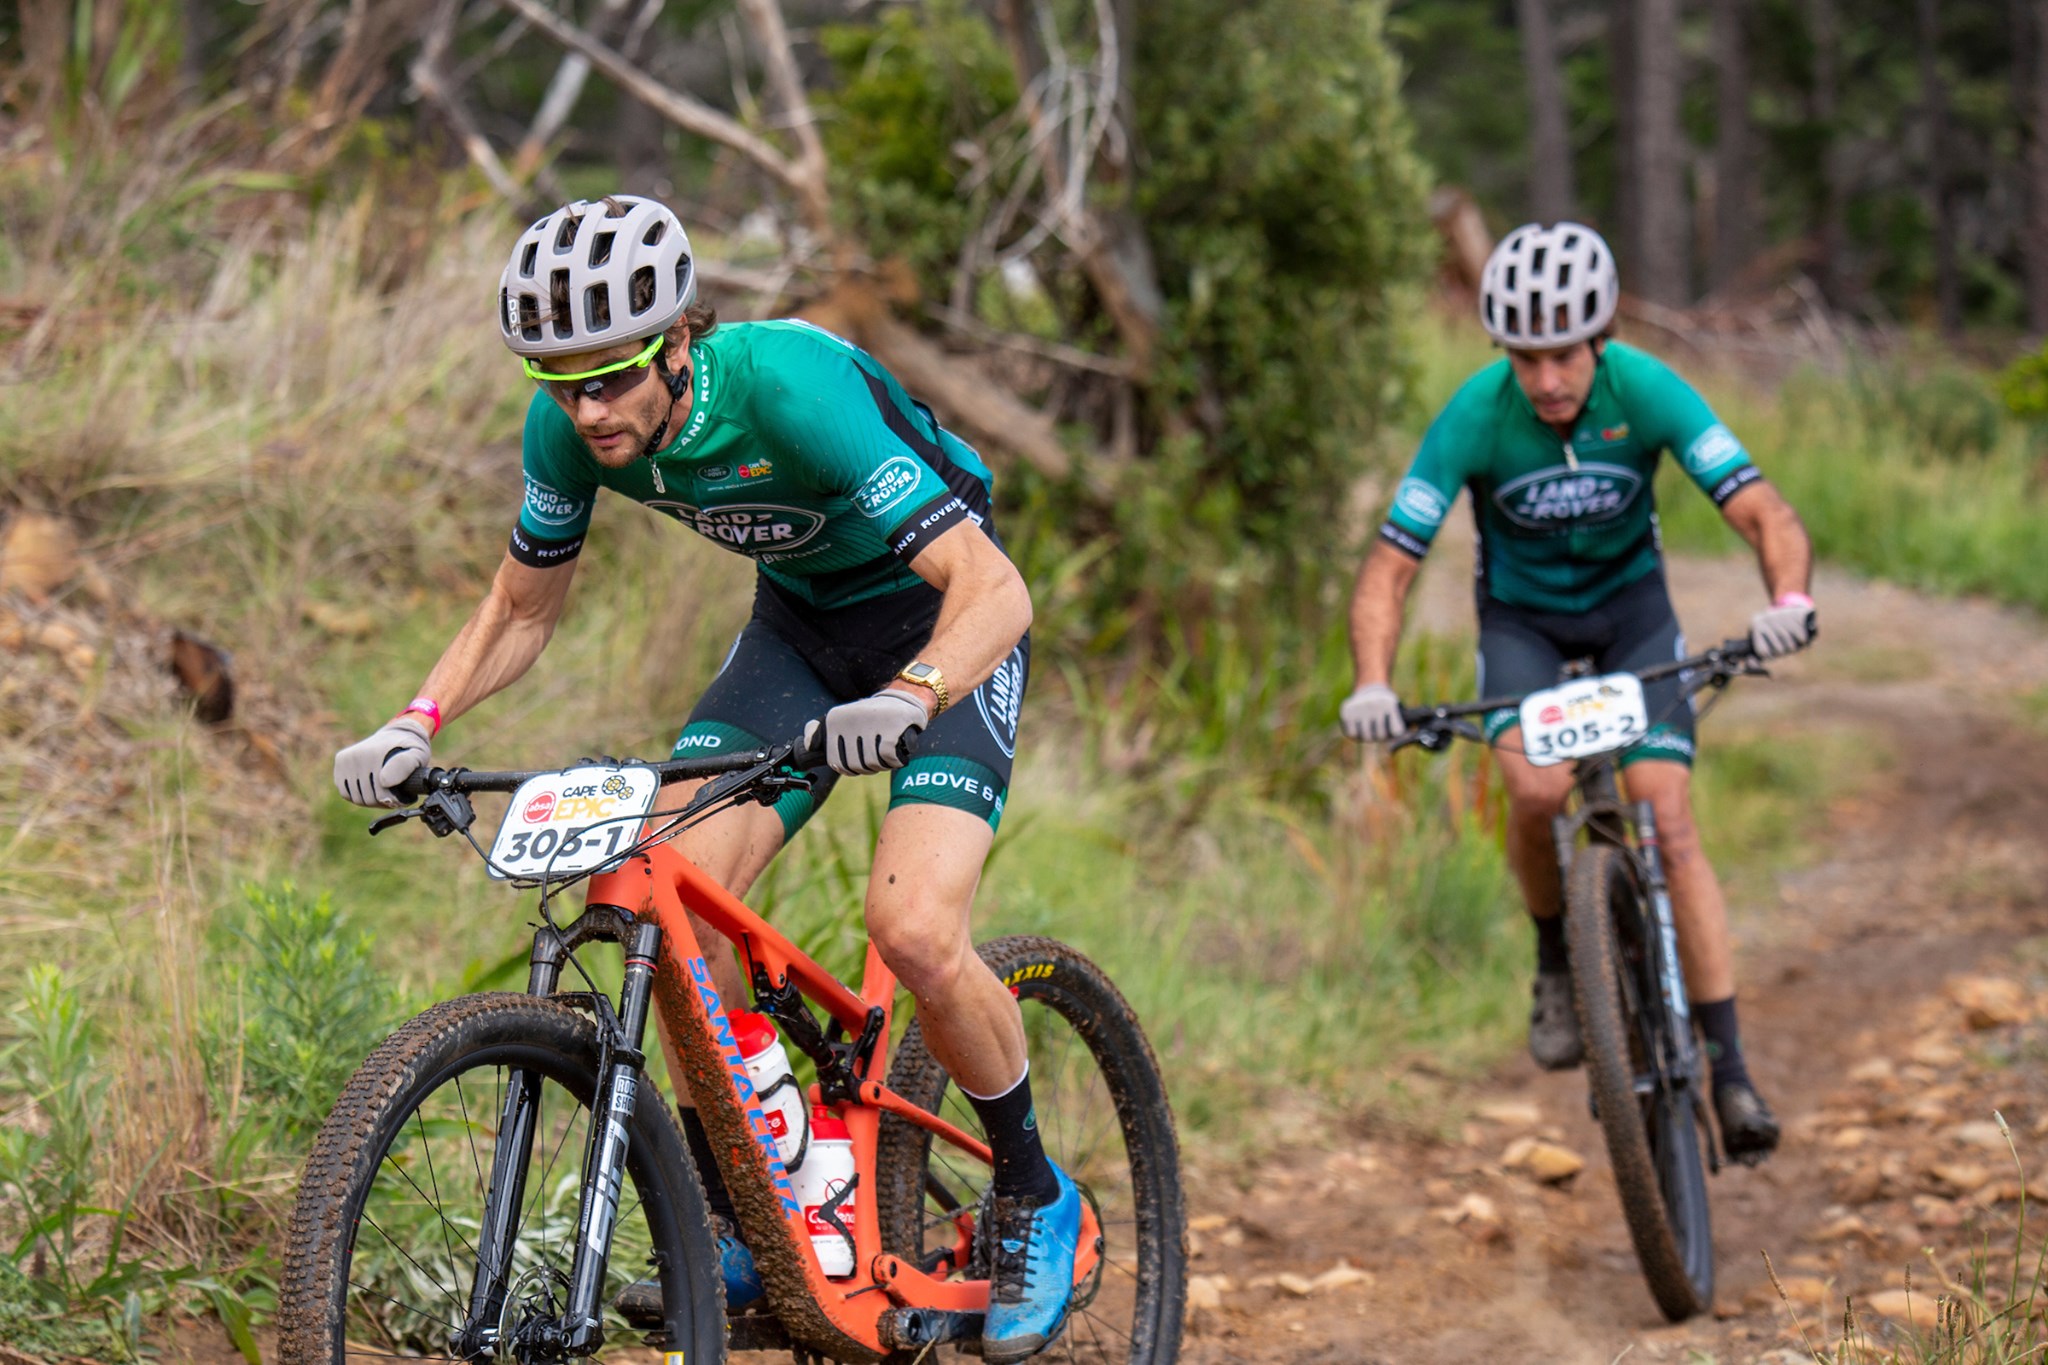
All categories start and finish stats 2021
| 2021 | Team Totals | % of Teams that DNF | Number of Solo Finishers | Total Finishers: Teams + Solo | Total % Finishers: Teams + Solo |
| All Teams Start | 290 | ||||
| All Teams Finish | 247 | 14.83% | 33 | 527 | 90.86% |
| Men Teams Start | 127 | ||||
| Men Teams Finish | 112 | 11.82% | 11 | 235 | 92.51% |
| Women Teams Start | 12 | ||||
| Women Teams Finish | 11 | 8.34% | 1 | 23 | 95.83% |
| Masters Teams Start | 77 | ||||
| Masters Teams Finish | 66 | 14.29% | 8 | 140 | 90.90% |
| Grand Masters Teams Start | 50 | ||||
| Grand Masters Teams Finish | 37 | 26% | 10 | 84 | 84% |
| Mixed Teams Start | 24 | ||||
| Mixed Teams Finish | 21 | 12.5% | 3 | 45 | 93.75% |
% of Teams that DNF
| 2017 | 2018 | 2019 | 2021 | |
| All | 24.4% | 16.1% | 13.5% | 14.8% |
| Men | 23.3% | 13.2% | 11.4% | 11.8% |
| Women | 14.1% | 25% | 16.7% | 8.3% |
| Masters | 15.3% | 24.8% | 10.3% | 14.3% |
| Grand Masters | 20.3% | 29.7% | 13.4% | 26% |
| Mixed | 20.5% | 27.5% | 20.8% | 12.5% |
It’s been a much bigger number in the past (27.4% in 2008!) but at 14.8%, the 2021 Cape Epic claimed more teams than the previous (2019) edition. With entrants to the 2020 edition permitted to postpone their entry and then entrants to 2021 encouraged to postpone their entry if possible, to trim the field to under 300 teams for Covid-19 regulation compliance, the reduced field that did line up this year was likely very well prepared.
% of total finishers – Teams & Solo
| 2017 | 2018 | 2019 | 2021 | |
| All | 84.1% | 90.6% | 92.2% | 90.9% |
| Men | 85.9% | 92.5% | 91.7% | 92.5% |
| Women | 92.6% | 83.3% | 86.1% | 95.8% |
| Masters | 84.1% | 90.8% | 93.8% | 90.9% |
| Grand Masters | 79.7% | 89.2% | 93.3% | 84% |
| Mixed | 77.5% | 87.7% | 88.7% | 93.7% |
Since the remaining teammate is permitted to continue should his/her teammate be forced to withdraw during the race, we also list total finishers for each edition. There wasn’t a huge drop in all finishers from 2019, but there was a drop. While the Women and the Mixed showed encouraging increases at 95.8% and 93.7% respectively over 2019, the Masters (90.9%) and Grand Masters (84%) were both down on 2019 – the latter well down!
The Absa Cape Epic is always tough. But it has always been tackled by riders living in a predictable world, where control over one’s preparation is a given. Since March 2020 much of that control has been removed by the reaction of national governments to the Covid-19 virus – more so for some than others. The preparation for the 2021 edition of the Cape Epic was hugely disrupted and the type of human this race attracts must have been tearing their hair out in frustration at times.
But in a world where so much has changed in the past 20 months, the familiarity of the Absa Cape Epic rolling through the Western Cape of South Africa in October 2021 was somewhat of a steadying factor. A sign that there are still islands of sanity in an ocean of uncertainty. As spectators, it was wonderful to witness, particularly with the very impressive daily live coverage. For the riders who’d conquered many waves of doubt, just getting to roll down that prologue start ramp was already a success. The race itself must have been incredible. There’s something quietly reassuring about the familiarity of suffering on a mountain bike in nature, no matter how deep that suffering needs to be.

General statistics after 2021 (new additions in red)
Most stage wins
Men:
38 Christoph Sauser (SUI)
20 Burry Stander (RSA)
17 Karl Platt (GER)
13 Jaroslav Kulhavy (CZE)
10 Nino Schurter (SUI)
12 Bart Brentjens (NED)
6 Mannie Heymans (NAM), Henrique Avancini (BRA), Manuel Fumic (GER)
Women:
31 Annika Langvad (DEN)
17 Hanlie Booyens (RSA), Ariane Lüthi (SUI)
14 Sharon Laws (GBR)
12 Esther Suss (SUI)
9 Hannele Steyn (RSA)
8 Anke Moore (RSA), Yolande de Villiers (RSA) and Sally Bigham (GBR), Sina Frei (SUI), Laura Stigger (AUT)
7 Sabine Spitz (GER), 7 Kate Courtney (USA), 7 Anna van der Breggen (NED)
Mixed:
18 Nico Pfitzenmaier (RSA)
15 Ariane Lüthi (SUI), Erik Kleinhans (RSA)
14 Sebastian Stark (GER), Laura Stark (GER)
10 Barti Bucher (SUI), Paul Cordes (RSA), Yolande Speedy (RSA)
8 Thomas Frischknecht (SUI), Jenny Rissveds (SWE)
Masters:
26 Bart Brentjens (NED)
25 Abraao Azevedo (BRA)
18 Shan Wilson (RSA)
17 Andrew McLean (RSA)
14 Linus van Onselen (RSA)
13 Doug Brown (RSA)
12 Nico Pfitzenmaier (RSA)
11 Carsten Bresser (GER), Udo Boelts (GER)
10 Robert Sim (RSA)
6 Joaquim Rodrigues (ESP), Jose Hermida (ESP), Craig Uria (RSA), Andrew Duvenage (RSA)
Grandmasters
32 Heinz Zoerweg (AUT)
28 Barti Bucher (SUI)
15 Bart Brentjens (NED)
13 Robert Sim (RSA)
13 Udo Boelts (GER)
8 Andrew McLean (RSA), Abraao Azevedo (BRA)
7 Peter Vesel (SLO)
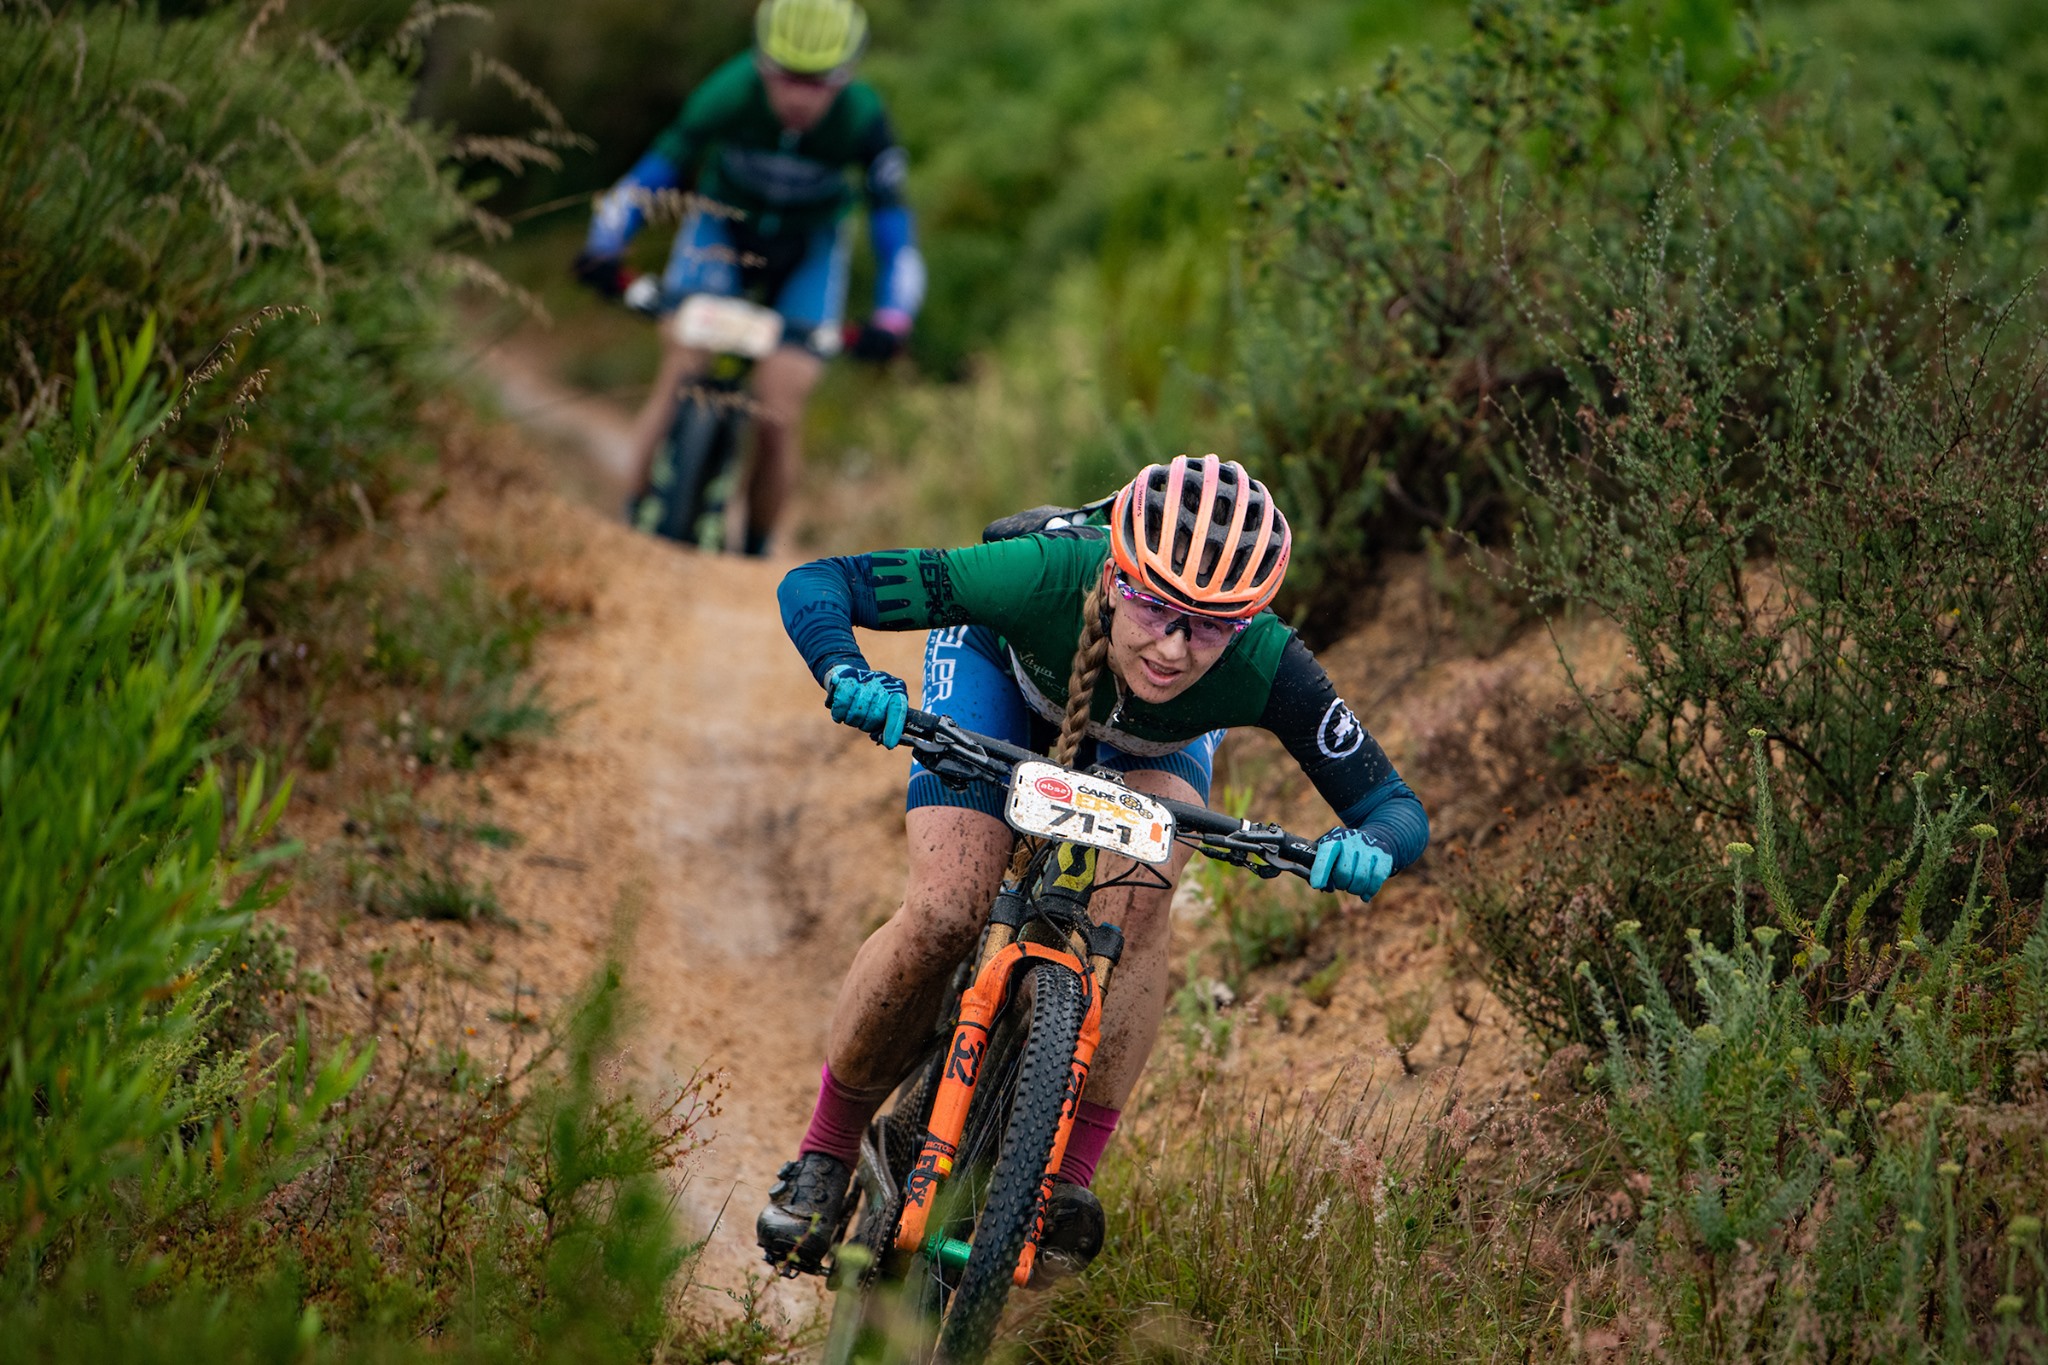
Africans (and South Africans) in the Cape Epic overall top 10 since 2006:
2021 – 6 (5 SA)
2019 – 2 (2 SA)
2018 – 0
2017 – 3 (3 SA)
2016 – 3 (3 SA)
2015 – 8 (8 SA)
2014 – 5 (5 SA)
2013 – 4 (4 SA)
2012 – 8 (8 SA)
2011 – 3 (1 SA)
2010 – 5 (5 SA)
2009 – 5 (3 SA)
2008 – 6 (5 SA)
2007 – 4 (3 SA)
2006 – 10 (6 SA)
South African Cape Epic overall stage winners – men:
20 Burry Stander
4 Kevin Evans
3 Shan Wilson
3 David George
3 Philip Buys
2 Matthew Beers
2 Matthys Beukes
2 Brandon Stewart
1 Jacques Rossouw
1 Gert Heyns
1 Ben-Melt Swanepoel
1 Richard Beswick
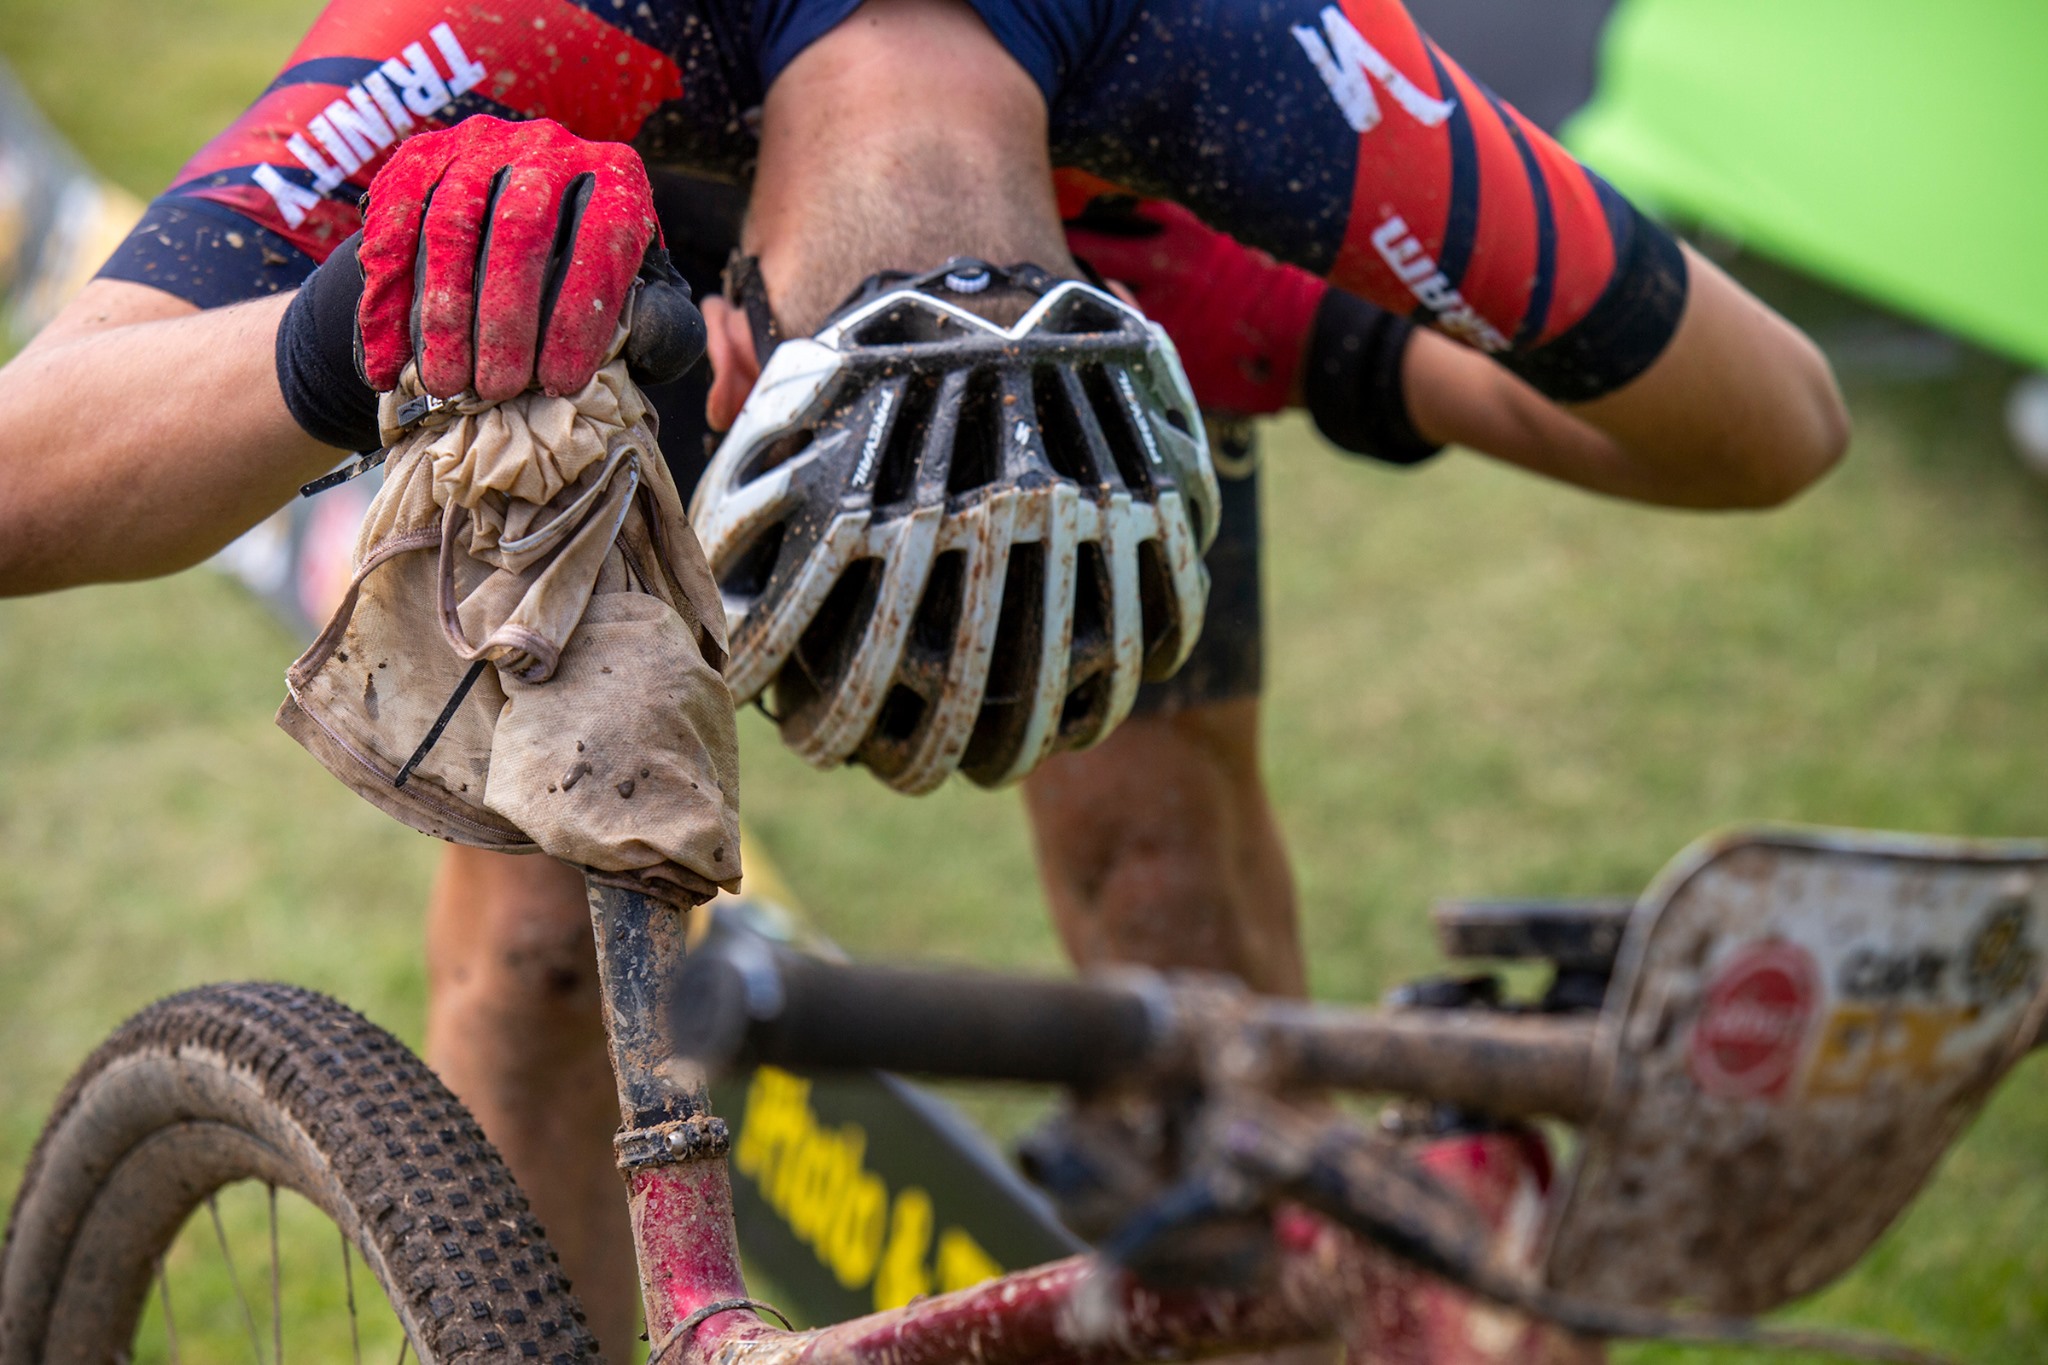
Multiple overall winners:
Men
5 Christoph Sauser (SUI) 2006, 2011, 2012, 2013, 2015
5 Karl Platt (GER) 2004, 2007, 2009, 2010, 2016
3 Stefan Sahm (GER) 2007, 2009, 2010
3 Jaroslav Kulhavy (CZE) 2013, 2015, 2018
2 Burry Stander (RSA) 2011, 2012
2 Roel Paulissen (BEL) 2005, 2008
2 Nino Schurter (SUI) 2017, 2019
Women
5 Annika Langvad (DEN) 2014, 2015, 2016, 2018, 2019
3 Ariane Kleinhans (SUI) 2014, 2015, 2016
2 Hanlie Booyens (RSA) 2004, 2009
2 Sharon Laws (GBR) 2004, 2009
2 Sally Bigham (GBR) 2011, 2012
2 Esther Süss (SUI) 2012, 2017
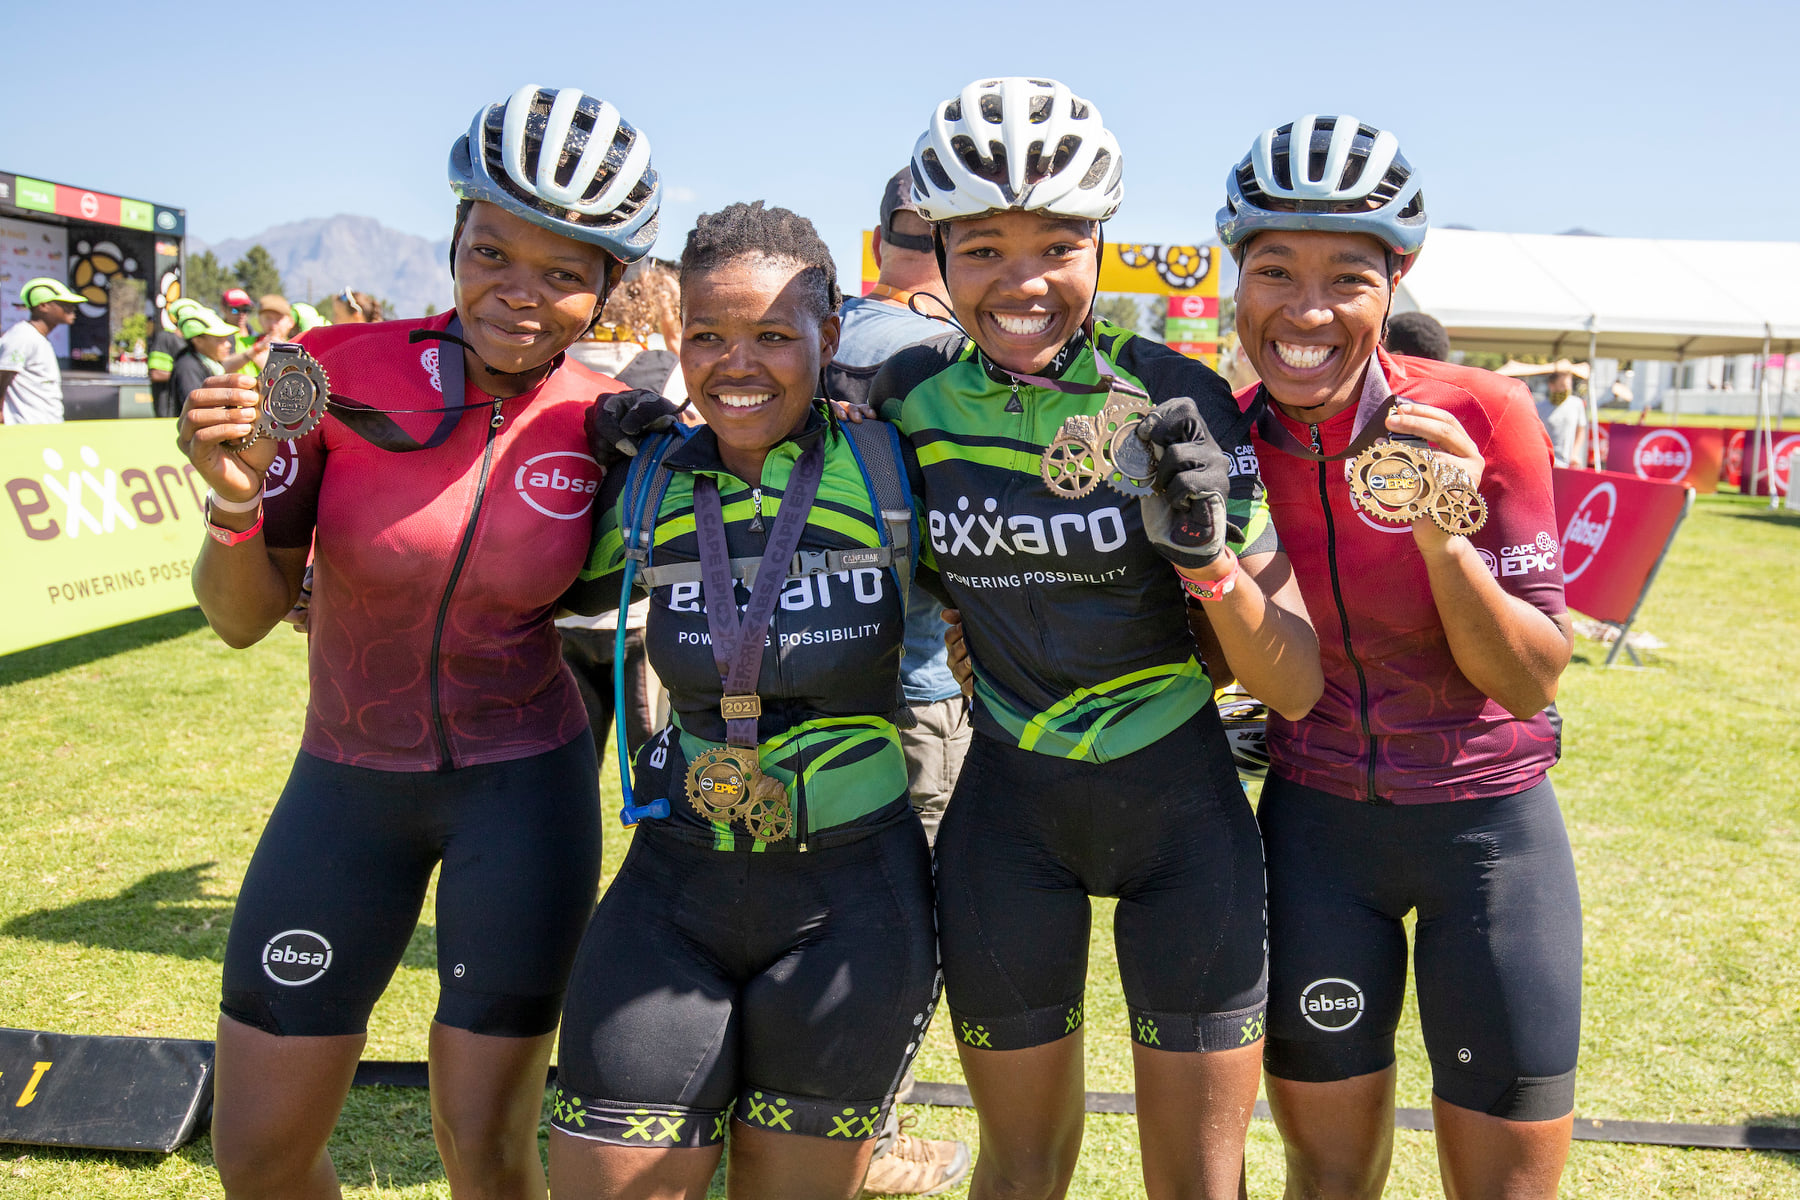
South Africans that have won Cape Epic titles:
Men: Burry Stander x 2, Matthew Beers
Women: Hanlie Booyens x2, Zoe Frost, Hannele Steyn, Anke Moore, Yolande de Villiers, Karien van Jaarsveld, Yolande Speedy
Mixed: Yolande Speedy/Paul Cordes x2, Erik Kleinhans x 2, Nic White/Anke Moore, Nicky Gilomee/Brennan Anderson
Masters: Doug Brown x 3, Andrew McLean x 2, Frank Soll, Duncan English, Fred Coleske, Linus van Onselen, Geddan Ruddock, Shan Wilson, Damian Booth, Craig Uria, Andrew Duvenage
Grand Masters: Robert Sim x 2, Andrew McLean
The Last Lions
Only four riders have completed every edition of the Cape Epic (17 in total). They are Hannele Steyn (55), Mike Nixon (62), John Gale (52) and Craig Beech (48) – all South Africans.
Since the reactions to Covid-19 led to the cancellation of the 2020 edition and the postponement of the 2021 edition, there was no new rider survey done. We did publish 2020 rider survey (many of those did the 2021 edition), so here’s a recap of those stats:
Absa Cape Epic 2020/2021 Gear Stats.
Absa Cape Epic 2020/2021 Bike Stats.
Absa Cape Epic 2020 Rider Stats.


